- Home
- Where does the UK currently export to outside of the EU?
Where does the UK currently export to outside of the EU?
Although the UK has left the European Union (EU), the EU remains the UK’s most important trading partner. The UK can now strike trade deals with other nations independently, so it is worth exploring where the opportunities for exports may lie. Here, we look at where the UK currently exports to outside of the EU.
Beef
Overview
- On average, 23% of UK beef exports and 39% of beef offal exports were shipped to non-EU countries between 2019 and 2021
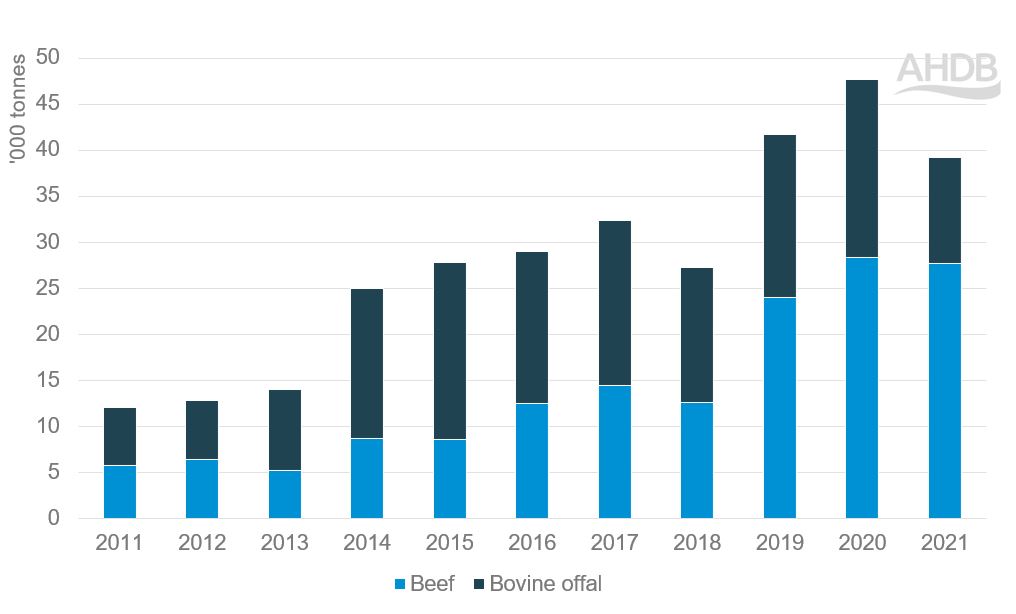
- Fresh and frozen beef exports to non-EU countries increased (Figure 1) from 4% in 2011 to 27% in 2021, representing an increase of just under 22,000 tonnes
- Beef offal exports more than doubled in the same period
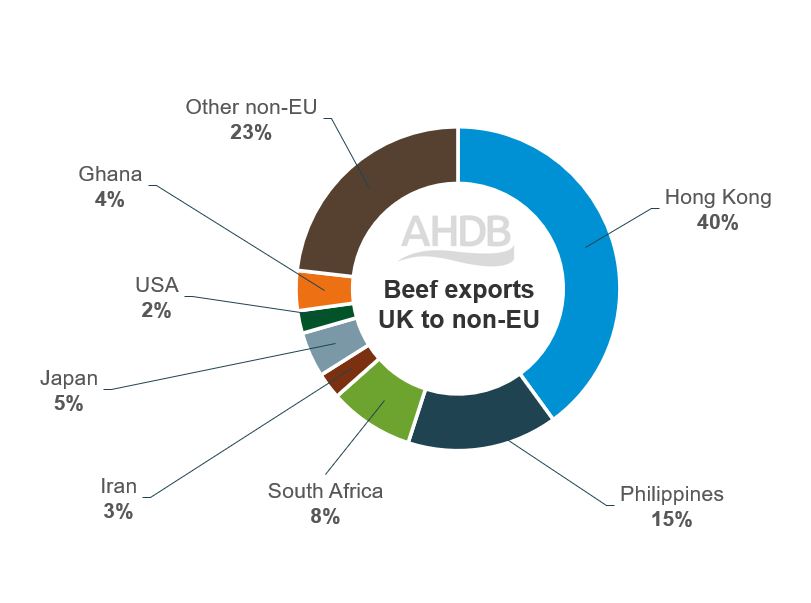
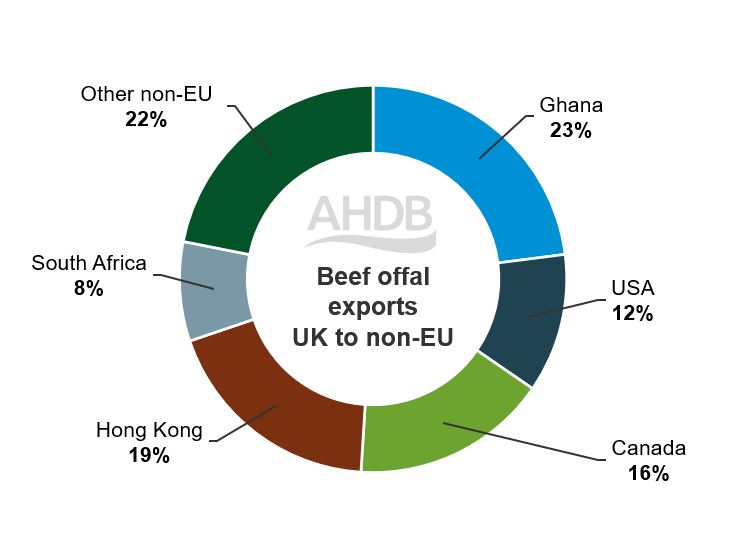
- Hong Kong and the Philippines were the main export destinations for fresh and frozen beef, while Ghana and Hong Kong were the main markets for beef offal
Figure 1. UK beef and bovine offal exports to non-EU countries, 2011–2021
Source: UK HMRC complied by Trade Data Monitor LLC
Fresh/frozen beef
- Hong Kong is the main non-EU export destination for UK beef in terms of value and volume (Figure 2). The UK exported an average of £28m per year in 2019–21, equating to an average of 10,660 tonnes
- Frozen boneless cuts are the largest beef exports to Hong Kong, with an average value of £15.8m and an average volume of 6,200 tonnes per year between 2019–2021. Fresh/chilled beef is the second most important product the UK has exported to Hong Kong in recent years
- The Philippines is next, with an average value of trade of £6.5m in 2019–2021, equating to an average of 4,000 tonnes
- Frozen boneless beef comprises the largest UK beef exports to the Philippines (2019–2021), with an average value of £3.8m and an average volume of 2,350 tonnes per year. The second largest UK beef export to the Philippines is fresh boneless beef
Figure 2. UK beef exports to non-EU countries, 2019–2021 average
Source: UK HMRC compiled by Trade Data Monitor LLC
Offal
- Between 2019 and 2021, an average of 3,700 tonnes of beef offal was exported to Ghana
- Hong Kong and Canada were also main destinations for UK beef offal exports, with just over an average of 3,000 tonnes and 2,700 tonnes exported, respectively (2019–2021)
Figure 3. UK beef offal exports to non-EU countries, 2019–2021 average
Source: UK HMRC compiled by Trade Data Monitor LLC
Sheep
Overview
- On average, 8% of UK sheep meat exports and 25% of sheep offal exports were sent to non-EU countries between 2019 and 2021
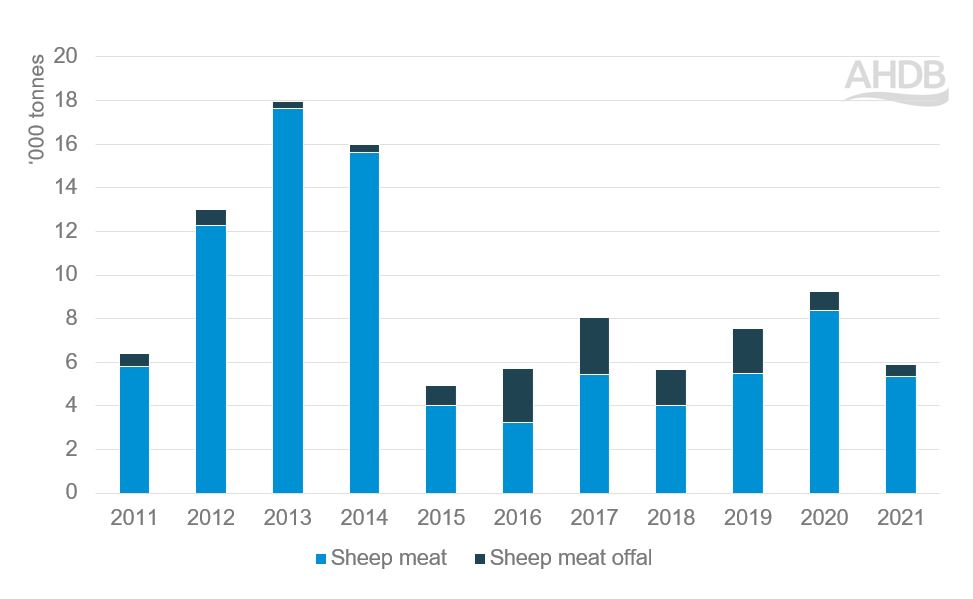
- Sheep meat exports to non-EU countries typically fluctuated around the 5,000 tonnes mark over the past decade, apart from 2012–2014, when exports were over 10,000 tonnes (Figure 4)
- Sheep meat offal exports have grown from hundreds of tonnes to thousands of tonnes over the past decade, although we have seen a setback in 2020 and 2021
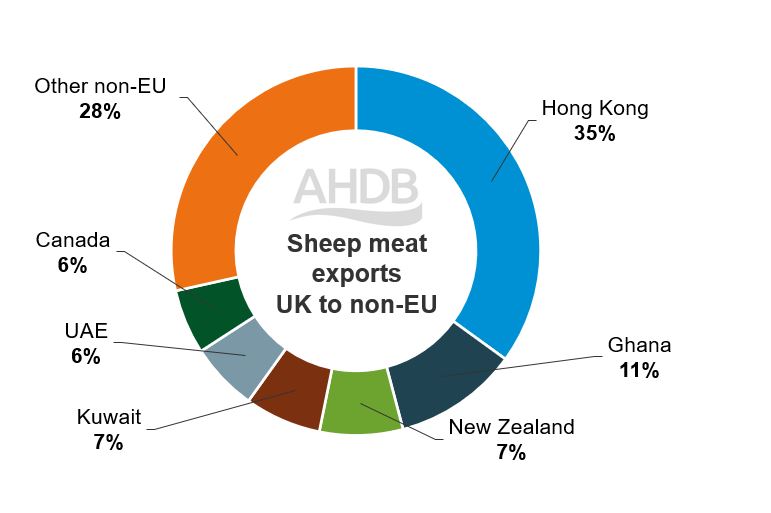
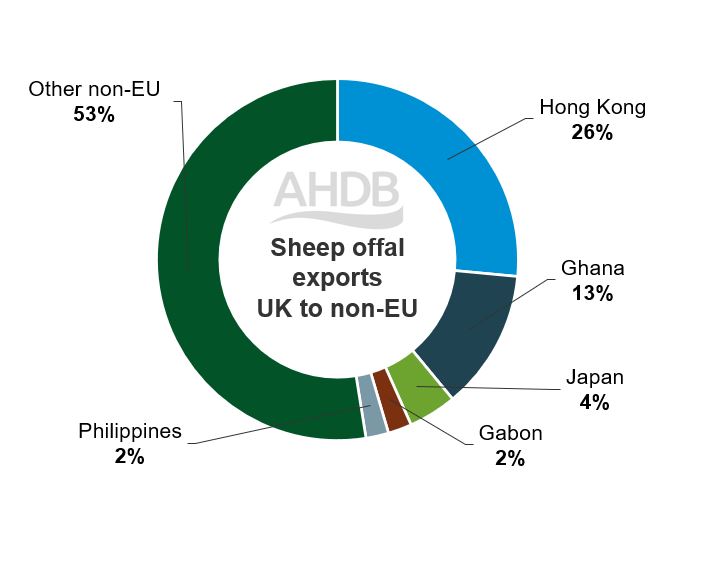
- Hong Kong and Ghana are the main non-EU export destinations for UK sheep meat on a volume basis and are also the main markets for sheep offal
Figure 4. UK sheep and sheep offal exports to non-EU countries, 2011–2021
Source: UK HMRC compiled by Trade Data Monitor LLC
Sheep meat
- The highest volume and value of sheep meat exports from the UK are sent to Hong Kong, with an average value of £5m and a volume of 2,200 tonnes per year between 2019–2021
- For Hong Kong, the largest export is bone-in frozen sheep meat, with an average value of £2.2m and an average volume of 1,172 tonnes per year
- The second largest sheep export to Hong Kong is boneless frozen lamb meat, with an average value of £1.39m, and an average volume of 450 tonnes per year
- After Hong Kong, the next biggest export market of sheep meat is Ghana (in volume terms), which imports an average of 700 tonnes (£697K in value terms)
- In value terms, however, Kuwait is the second largest export market after Hong Kong (average value of £3.2m, 429 tonnes, between 2019 and 2021)
- The highest value export to Kuwait between 2019–2021 was fresh or chilled full/half lamb carcases at an average value of £2.07m (average volume of 250 tonnes per year)
- The main product exported to Ghana in the same time period was frozen lamb carcases and half carcases (average of 166 tonnes, value of £161K)
Figure 5. UK sheep meat exports to non-EU destinations, 2019–2021 average
Source: UK HMRC compiled by Trade Data Monitor LLC
Offal
- Hong Kong was the main export market for UK sheep offal between 2019 and 2021, with an average of 797 tonnes exported
- Ghana was the next prominent destination, with an average of 165 tonnes exported from 2019 to 2021
Figure 6. UK sheep offal exports to non-EU destinations, 2019–2021 average
Source: UK HMRC compiled by Trade Data Monitor LLC
Pork
Overview
- On average, 55% of UK pig meat exports and 73% of pig meat offal exports were shipped to non-EU countries between 2019 and 2021
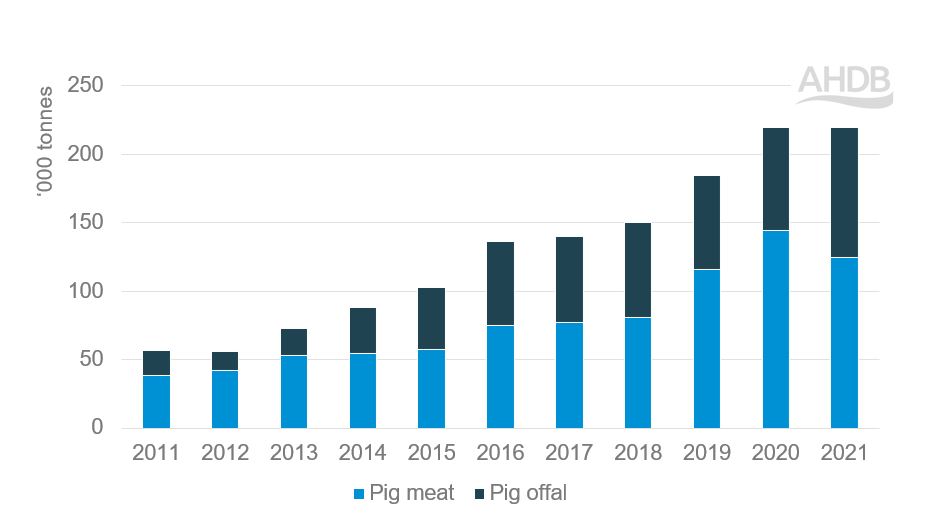
- Pig meat exports to non-EU countries increased steadily between 2011 and 2021 from 38,500 tonnes to 124,500 tonnes
- Pig meat offal exports have also grown from 18,100 tonnes in 2011 to 94,700 tonnes in 2021 (Figure 9)
- China is by far the main non-EU export destination for UK pig meat and offal
Figure 7. UK pig meat exports to non-EU destinations, 2011–21
Source: UK HMRC compiled by Trade Data Monitor LLC
Pig meat
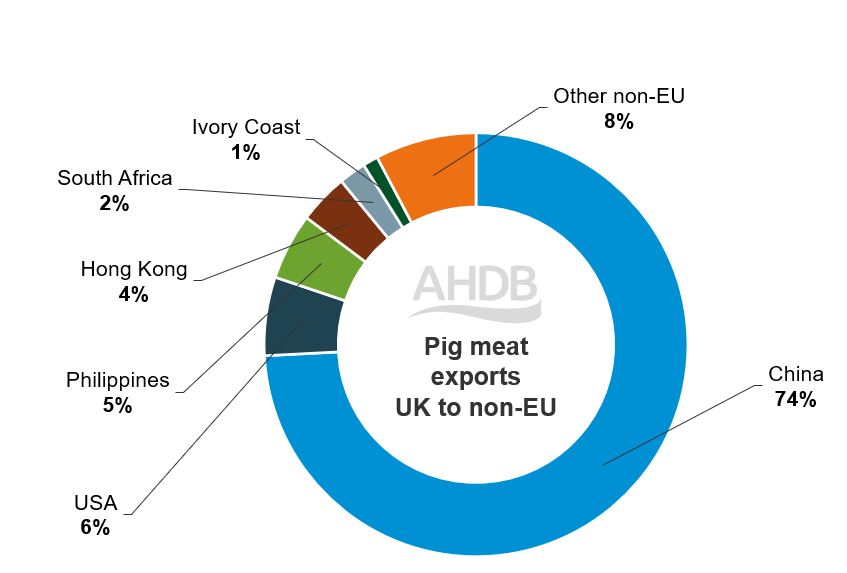
- China accounted for over 70% of UK pig meat exports to non-EU countries between 2019 and 2021. During this period, an average of 95,200 tonnes were shipped to China (average value of £154m)
- Bone-in frozen pork was the main product exported at an average value of £35.27m, with an average volume of 24,800 tonnes per year
- The second highest value and volume cut exported to China was frozen fore-ends and cuts of domestic swine at an average value of £30.3m and an average volume of 17,550 tonnes per year
- Bone-in frozen meat of non-domestic swine was the third major product exported, with an average value of £22m and an average volume of 14,300 tonnes per year
- The USA was the second largest non-EU market from 2019 to 2021, with an average of 7,700 tonnes (average value of £25m)
- A similar amount of pig meat was shipped to the Philippines over the same time period (average of 6,500 tonnes), although the average value of exports is much lower (£9.8m)
- Frozen fore-ends and cuts thereof of domestic swine were the highest value and volume product cut exported to the USA, with an average value of £12.8m per year and an average volume of 4,000 tonnes per year
Figure 8. UK pig meat exports to non-EU destinations, 2019–2021 average
Source: UK HMRC compiled by Trade Data Monitor LLC
Offal
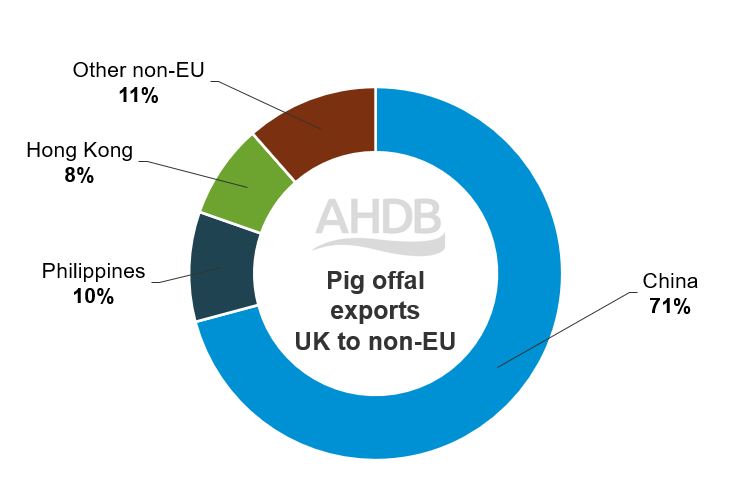
- UK pig meat offal exports to China averaged 56,300 tonnes between 2019 and 2021
- The Philippines and Hong Kong are also important markets, with an average of 7,600 tonnes and 6,500 tonnes exported to these countries from 2019 to 2021
Figure 9. UK pig offal exports to non-EU destinations, 2019–2021 average
Source: UK HMRC compiled by Trade Data Monitor LLC
Dairy
Butter overview
- Between 2019 and 2021, an average of 17% of UK butter exports were sent to non-EU countries
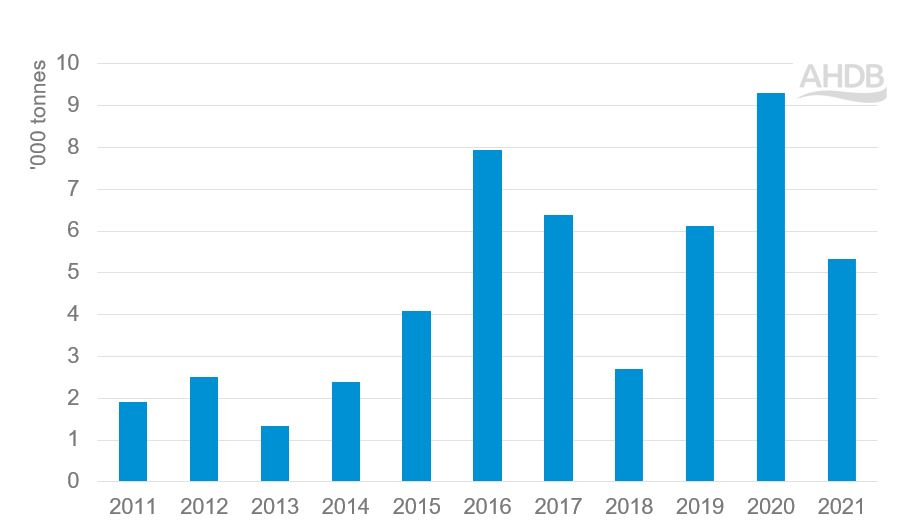
- UK butter exports to non-EU countries have grown considerably over the past decade, although there have been a few blips along the way
- Non-EU butter exports averaged 6,900 tonnes between 2019 and 2021
Figure 10. UK butter exports to non-EU destinations, 2011–21
Source: UK HMRC compiled by Trade Data Monitor LLC
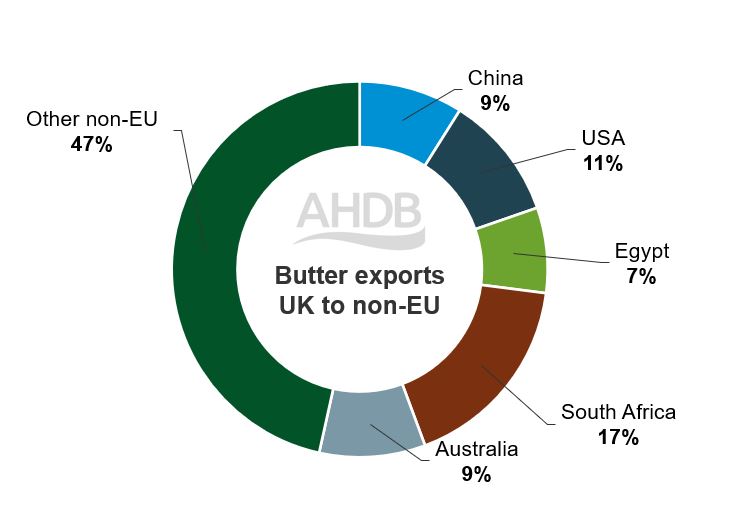
- The top non-EU destination for UK butter exports between 2019 and 2021 was South Africa, where an average of 1,200 tonnes were exported at an average value of £4.2m
- The USA was the second largest non-EU export market over this time period, with an average of around 750 tonnes exported at an average value of £3.5m
- Australia and China were the next main destinations, with an average of 630 tonnes and 620 tonnes exported, respectively
Figure 11. UK butter exports to non-EU destinations, 2019–2021 average
Source: UK HMRC compiled by Trade Data Monitor LLC
Cheese overview
- On average, 20% of UK cheese exports were exported to non-EU countries between 2019 and 2021
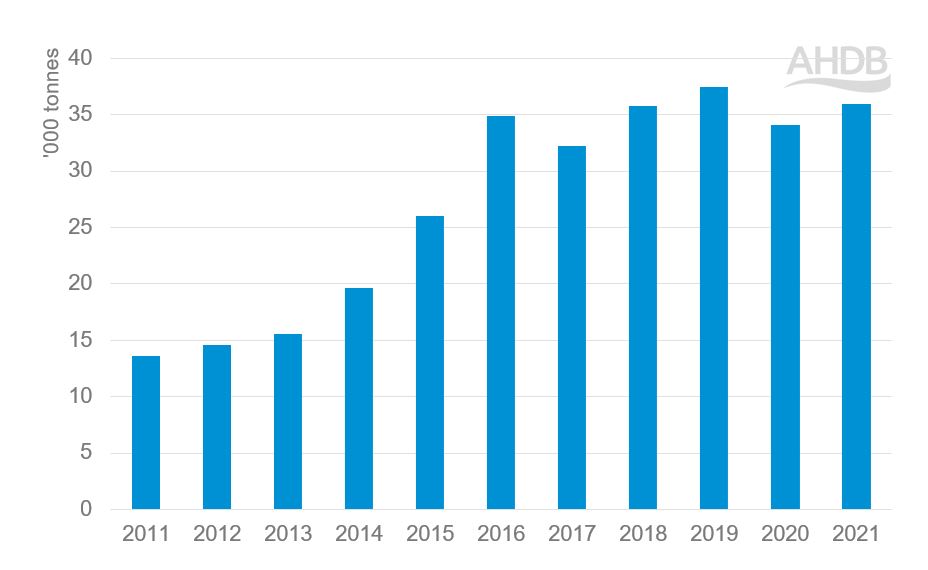
- UK cheese exports to non-EU countries increased from 13,600 tonnes in 2011 to 36,000 tonnes in 2021 (Figure 12)
Figure 12. UK cheese exports to non-EU destinations, 2011–2021
Source: UK HMRC compiled by Trade Data Monitor LLC
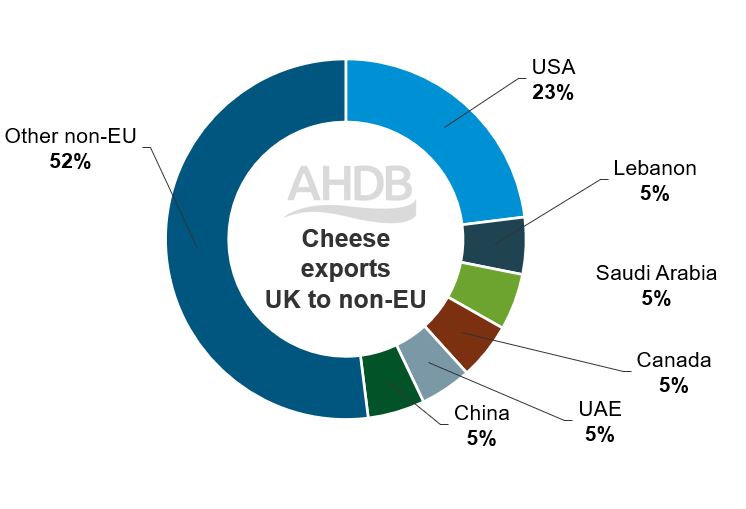
- The USA was the top destination for UK cheese between 2019 and 2021. Exports to the USA averaged 8,250 tonnes exported at an average value of £49.6m
- Exports to Lebanon, Saudi Arabia, Canada, and China all averaged around 1,800 tonnes during this time period
- UK cheese exports to Lebanon, Saudi Arabia and China had an average value of £5.6–6.4m, but exports to Canada were of a higher value, averaging £13.9m between 2019 and 2021
Figure 13. UK cheese exports to non-EU destinations by country, 2019–2021 average
Source: UK HMRC compiled by Trade Data Monitor LLC
Milk powders overview
- Between 2019 and 2021, an average of 41% of UK milk powder exports were shipped to non-EU countries
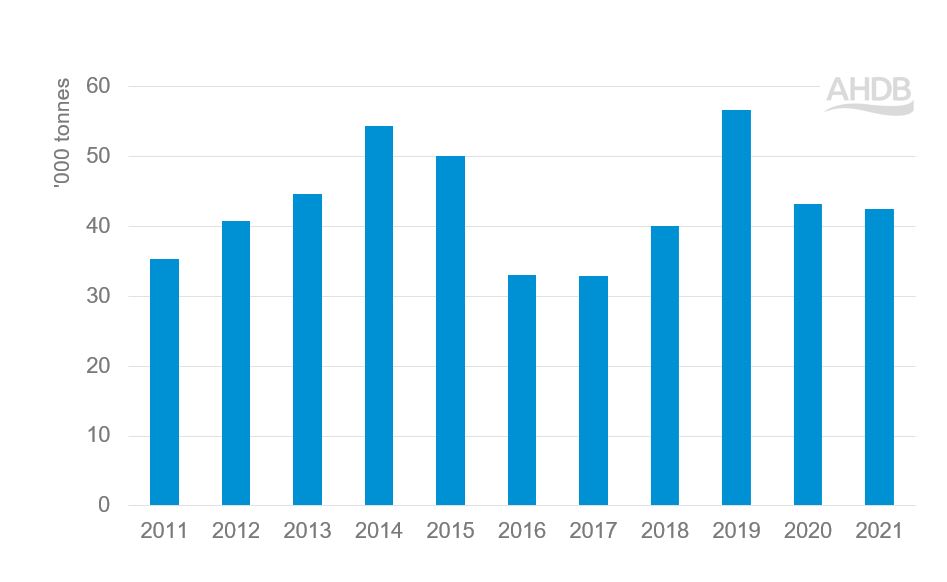
- UK milk powder exports to non-EU countries have fluctuated but remained above 30,000 tonnes over the past decade
- An average of 47,400 tonnes of milk powders were exported to non-EU countries between 2019 and 2021
Figure 14. UK milk powder exports to non-EU destinations, 2011–2021
Source: UK HMRC compiled by Trade Data Monitor LLC
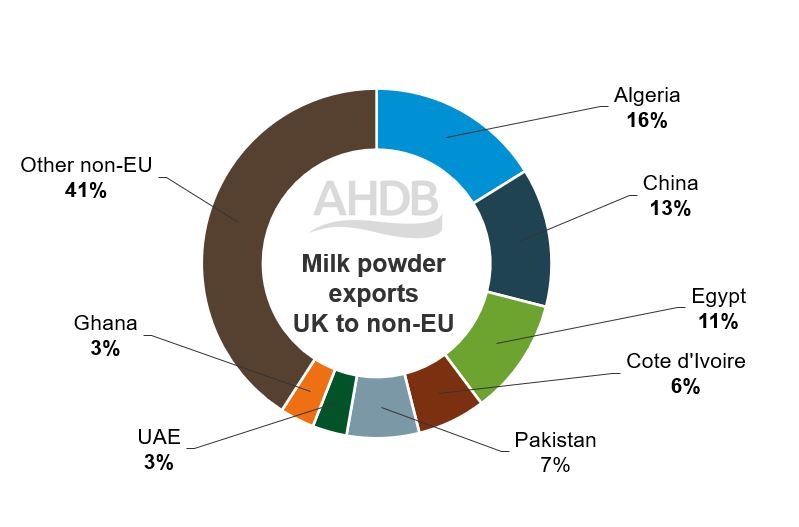
- Between 2019 and 2021, Algeria was the top non-EU export destination for UK milk powder exports by volume, with an average of 7,660 tonnes exported (average value of £18.3m)
- China, however, was the top non-EU destination in terms of value of exported product, which averaged £33.6m (average volume of 6,100 tonnes)
- Egypt has also been an important destination, with an average of 5,100 tonnes exported to the country at an average value of £10.4m
Figure 15. UK milk powder exports to non-EU destinations by country, 2019–2021 average
Source: UK HMRC compiled by Trade Data Monitor LLC
Cereals
Wheat
- The amount of wheat exported by the UK depends on production in any given year and can vary considerably
- The EU is the most important trading partner for the UK wheat market, with over 90% of UK wheat exports shipped to the trading bloc over the past five years on average
- Domestic production and supplies around the world, particularly those of the UK’s main competitors and the relative competitiveness of UK grain, are all key factors determining the level of exports in any given year
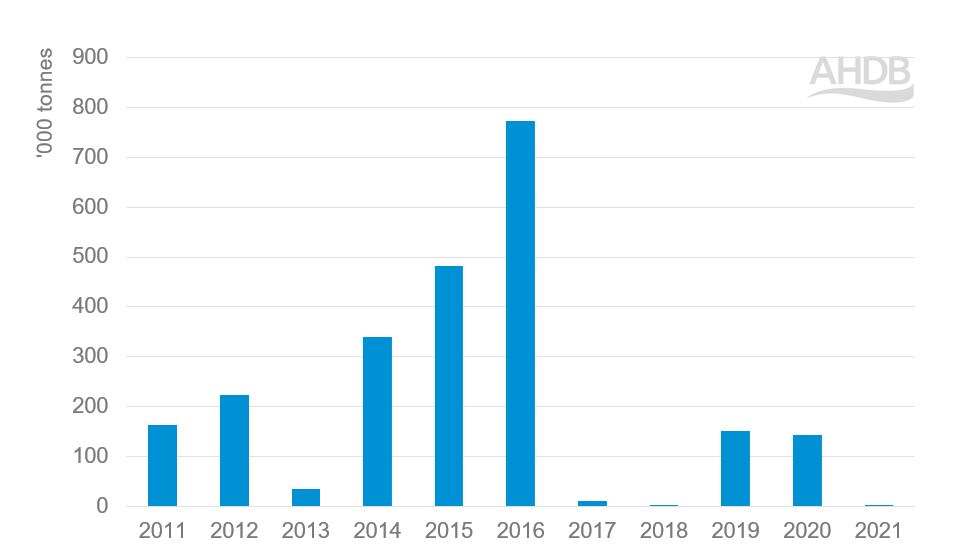
Figure 16. UK wheat exports to non-EU destinations, 2011–2021
Source: UK HMRC compiled by Trade Data Monitor LLC
- In recent years, UK wheat has been exported to Algeria, the United States, Iceland and Turkey, with an average value (2018–2021) of £5.0m, £2.5m and £0.8m, respectively
- A shipment of over 100,000 tonnes of wheat was also sent to Nigeria in 2020, although this is a one-off situation
- Morocco has also been a key export destination over the past decade, although exports to the country have tapered off since 2016
- Morocco, Spain and Portugal are key customers of UK biscuit wheat
Barley
- While the EU is also the primary market for UK barley exports, considerable amounts have been shipped to non-EU countries
- Following a period where over 300,000 tonnes of UK barley was exported to countries outside the EU annually between 2013 and 2016, volumes have dropped in recent years with the exception of 2020
Figure 17. UK barley exports to non-EU destinations, 2011–2021
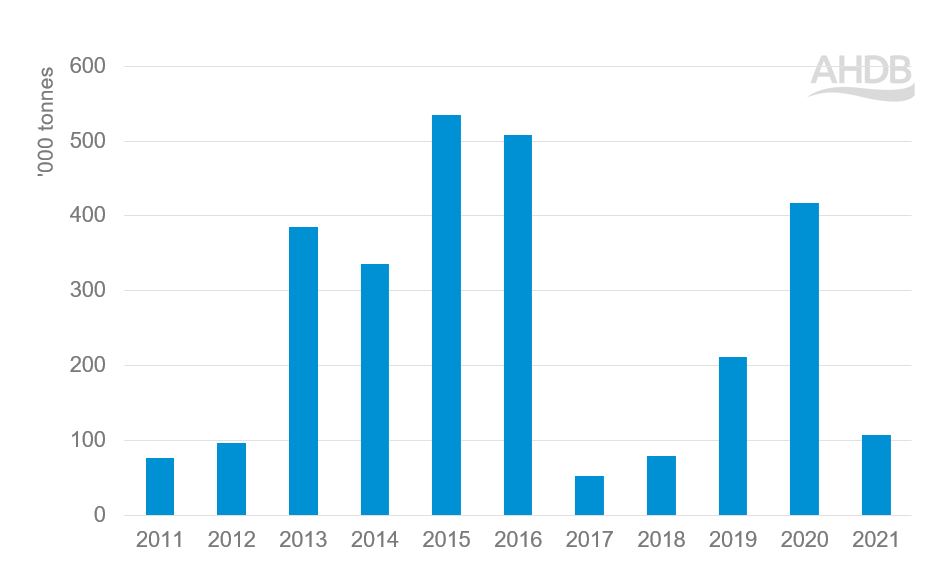
Source: UK HMRC compiled by Trade Data Monitor LLC
- Key non-EU destinations for UK barley exports (2019–2021 average) were Tunisia (£9.1m), Morocco (£11.2m), Algeria (£8.1m) and Saudi Arabia (£6.1m)
- UK barley exported to these countries is feed grade rather than malting barley

