- Home
- Markets and prices
- Dairy markets - Supply and demand - Industry structure - UK processor numbers
-
Beef markets
- Beef markets home
- Market analysis
- Prices
- Supply and demand
- Imports and exports
- Cost of production and performance
-
Lamb markets
- Lamb markets home
- Market analysis
- Prices
- Supply and demand
- Imports and exports
- Cost of production and performance
-
Pork markets
- Pork markets home
- Market analysis
-
Prices
- Deadweight pig prices
- EU weaner prices
- Supermarket red meat prices
- Farm costs
- Exchange rates
-
Supply and demand
- Industry structure
- Slaughter and production
- Carcase information
- Consumption
- Imports and exports
- Cost of production and performance
-
Dairy markets
- Dairy markets home
- Market analysis
-
Prices
- Milk price calculator
- Farmgate milk prices
- Wholesale prices
- Retail prices
- Farm costs
- Exchange rates
-
Supply and demand
- Industry structure
- Dairy production
- Composition and hygiene
- Consumption
- Imports and exports
-
Cereals and oilseeds markets
- Cereals and oilseeds markets home
- Market analysis
- Prices
- Supply and demand
- Imports and exports
- Nature markets
- Retail and consumer insight
- Agri Market Outlook
- Farm standards review
UK processors data
Updated 17 December 2019
This information shows the number and size of UK enterprises buying ex-farm milk, and those producing dairy products. The data comes from a Defra survey, which takes place every three years.
Overview - 2018
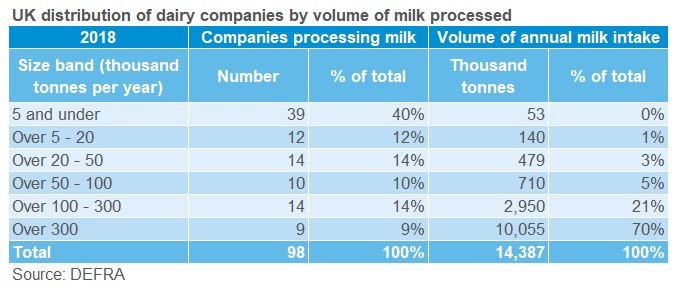
- Around 70% of the UK’s annual milk intake is processed by 9 companies.
- Enterprises processing less than 5,000 tonnes of milk each per annum account for 40% of the total number of enterprises. However, they process less than 0.4% of the annual milk intake.
- In the cheese market, around 93% of output in the UK comes from 17 companies.
- In the butter market, enterprises producing less than 100 tonnes per year account for 57% of the total number of enterprises. However, they only account for 0.3% of total butter production.


Additional information
Note: numbers of companies exclude direct sellers.
While AHDB seeks to ensure that the information contained on this webpage is accurate at the time of publication, no warranty is given in respect of the information and data provided. You are responsible for how you use the information. To the maximum extent permitted by law, AHDB accepts no liability for loss, damage or injury howsoever caused or suffered (including that caused by negligence) directly or indirectly in relation to the information or data provided in this publication.
All intellectual property rights in the information and data on this webpage belong to or are licensed by AHDB. You are authorised to use such information for your internal business purposes only and you must not provide this information to any other third parties, including further publication of the information, or for commercial gain in any way whatsoever without the prior written permission of AHDB for each third party disclosure, publication or commercial arrangement. For more information, please see our Terms of Use and Privacy Notice or contact the Director of Corporate Affairs at info@ahdb.org.uk © Agriculture and Horticulture Development Board. All rights reserved.

