Future trade deals: Australia - Cereals & Oilseeds
Monday, 1 February 2021
As the UK explores new trade deals with Australia and New Zealand, we have begun to “set the scene” by focusing on key facts and figures regarding production and trade for both of these countries. Following on from our snapshot of the Australian livestock sector, in this article we examine cereals and oilseeds production and trade in Australia.
Wheat
|
Annual production and trade, 2017–2019 average (crop years) |
||
|
|
 |
 |
|
PRODUCTION (3-yr avg) |
17.9mt |
14.9mt |
|
TOTAL EXPORTS (3-yr avg) |
11.8mt |
747kt |
|
TOTAL IMPORTS (3-yr avg) |
245kt |
1.8mt |
|
Source: ABARES, Defra, HMRC, IHS Maritime & Trade - Global Trade Atlas® |
||
While Australia’s output of wheat is relatively modest compared to countries such as the US, Russia and the EU, it is an important player in the global wheat market as it exports a considerable proportion of its production. Australia is regarded as a top-up supplier of wheat in the Northern Hemisphere due to the timing of its wheat harvest.
The main types of wheat grown in Australia are:
Australian Premium White (APW) – comprises 30-40% of total production, has good milling properties and is used to produce a wide variety of breads (including Middle Eastern flat breads) and noodles.
Australian Standard White (ASW) – forms around 20-25% of the total wheat crop. Has good milling properties and can be used in a range of baked products as well as steamed breads and noodles.
Australian Hard (AH) – comprises 15-20% of total wheat output. Has superior milling and dough properties. Suitable for a range of products including flat breads, noodles and steamed breads.
Australian Prime Hard (APH) – 5-10% of the Australian wheat crop. A high protein and high milling quality wheat. Most suitable for high volume European breads and certain noodles but can also be blended with lower protein wheats to make high quality flours which can be used in a variety of products.
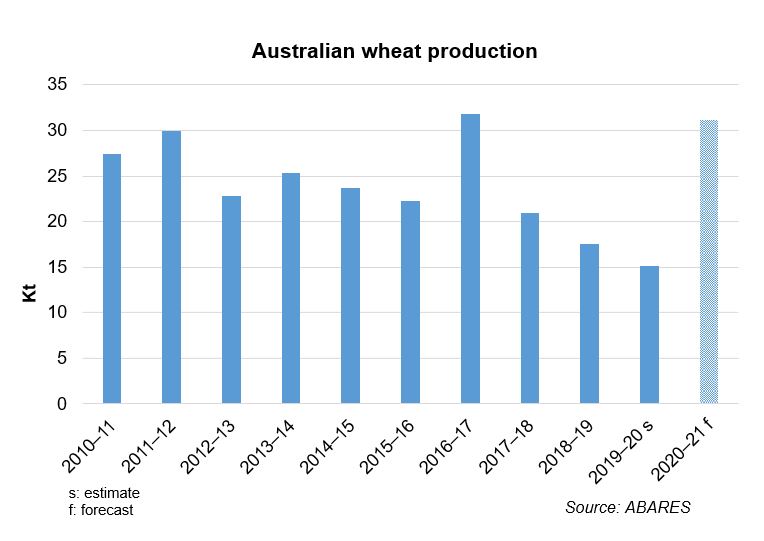
In typical years, Australia usually exports around 70% of the wheat it produces. However, due to smaller crops in the past few crop years (caused by severe drought), the proportion exported has fallen to around 50-60%. Nevertheless, a bumper crop (31.2m tonnes) is expected in 2020/21 (ABARES).
Over the past three crop years, Indonesia has been the top export destination for Australian wheat.
Top 5 export destinations for Australian wheat (2017/18–2019/20 avg)
|
|
Quantity, m tonnes |
Value, £ millions |
Unit price, £/t |
|
Indonesia |
1.8 |
318.7 |
179 |
|
Philippines |
1.4 |
244.3 |
180 |
|
South Korea |
1.1 |
210.9 |
194 |
|
Vietnam |
1.0 |
194.4 |
193 |
|
Japan |
0.91 |
192.0 |
212 |
The small amount of wheat Australia imports is primarily from Canada.
UK
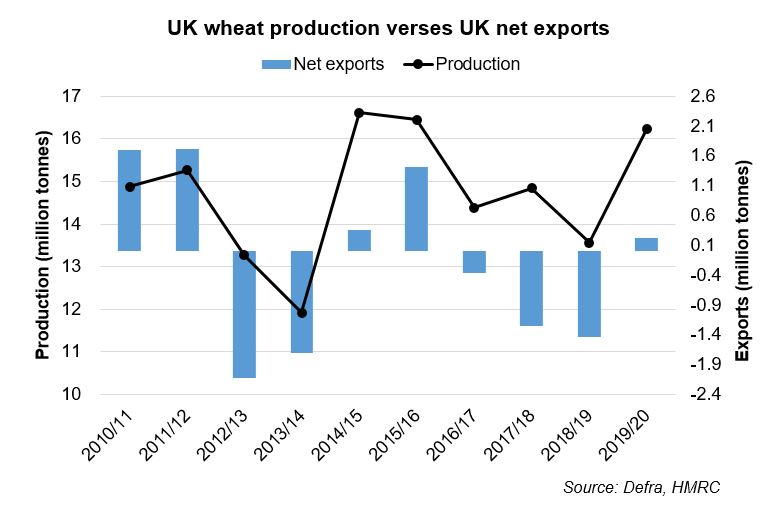
The UK’s net trade position varies from year to year depending on domestic demand requirements and the size of the crop. Typically, the UK is a net importer of milling wheat, while any surplus feed wheat is exported.
While the UK wheat crop has averaged around 15Mt (2017/18-2019/20), the 2020 harvest was much smaller (9.7Mt).
As the graph below shows, the UK is usually a net importer of wheat if the domestic crop size is below 15 million tonnes.
UK feed wheat faces competition from maize imports, which can be partially substituted into animal feed rations. Two major bioethanol plants in the UK can dictate UK feed wheat consumption and one of these can also use maize as feedststock. Currently (2021), only one bioethanol plant in the UK is operational, albeit at reduced capacity.
UK wheat imports predominately come from the EU but the share of non-EU imports has been increasing in recent years. Imports of milling grade wheat come from North America as well as Germany and France. Rules of Origin (RoO) limits apply to UK-made flour. Under the EU-UK Trade and Cooperation Agreement, EU materials and processing count as UK materials and processing for products exported to the EU and vice versa. However, if non-UK and EU materials, for example, are used in UK product exports then they may incur tariffs if the amount or value exceeds the agreed level. As mentioned above, Canadian wheat is imported for milling purposes and so if flour is exported from the UK to Ireland, for example, a tariff will apply if it contains more 15% Canadian wheat.
UK wheat import origins (2017/18-2019/20 average)
|
|
Quantity, Kt |
Value, £million |
Unit value £/t |
|
Canada |
384 |
86.6 |
225 |
|
France |
262 |
48.6 |
186 |
|
Germany |
222 |
39.0 |
175 |
|
Bulgaria |
181 |
30.2 |
167 |
|
Romania |
132 |
22.1 |
167 |
Most of the UK’s wheat exports are primarily feed wheat and are destined for the EU, with additional shipments to North Africa.
UK wheat export destinations (2017/18-2019/20 average)
|
|
Quantity, Kt |
Value, £million |
Unit value £/t |
|
Ireland |
195 |
32.8 |
168 |
|
Netherlands |
172 |
27.2 |
158 |
|
Spain |
144 |
24.3 |
169 |
|
Portugal |
52 |
8.6 |
164 |
|
Algeria |
32 |
5.0 |
157 |
UK/ Australia wheat trade
UK wheat imports from Australia have averaged 4.7Kt (2017/18-2019/20) whereas UK exports have averaged just 8 tonnes over the same time period. UK imports of Australian wheat is for the milling wheat market rather than the feed wheat market. Canadian wheat is preferred by UK millers as it complements UK wheat well as part of a blend.
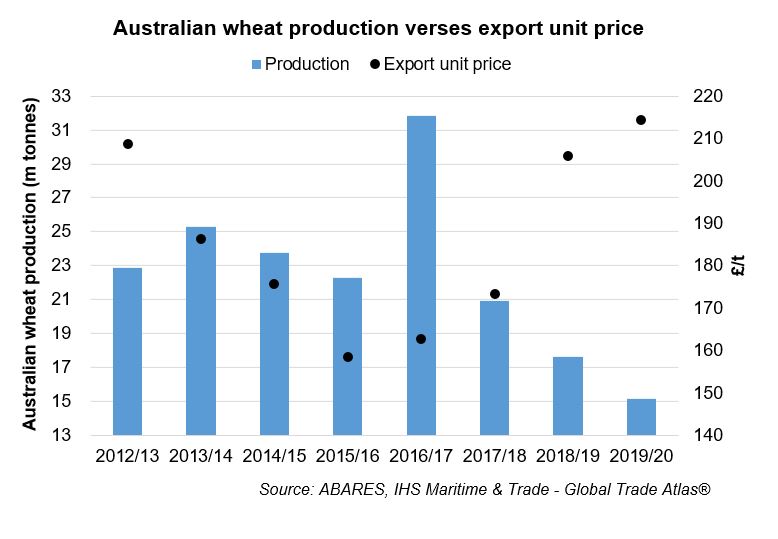
The average unit price for UK wheat imports between 2017/18 and 2019/20 was £192/tonne, whereas the average unit price for Australian wheat exports during this period was £198/tonne. As expected, the price will reflect, to some extent local supply and demand dynamics, but global prices will also have a bearing. Due to severe drought in the past few crop years, Australian wheat export prices have been higher.
For wheat, there isn’t a substantial amount of trade between the UK and Australia. As mentioned earlier, Canadian wheat is the main non-EU wheat used by millers and it is unlikely that UK millers would want to shift away from this as it is a tried and tested component of UK millers’ grists.
Barley
|
Annual production and trade, 2017–2019 average (crop years) |
||
|
|
 |
 |
|
PRODUCTION (3-yr avg) |
9.0m tonnes |
7.3m tonnes |
|
TOTAL EXPORTS (3-yr avg) |
4.7m tonnes |
997k tonnes |
|
TOTAL IMPORTS (3-yr avg) |
96 tonnes |
94k tonnes |
|
Source: ABARES, Defra, HMRC, IHS Maritime & Trade - Global Trade Atlas® |
||
Australia is a net exporter of barley and typically exports around 60% of its production (although this figure dropped to around 40% in recent years due to lower production caused by drought).
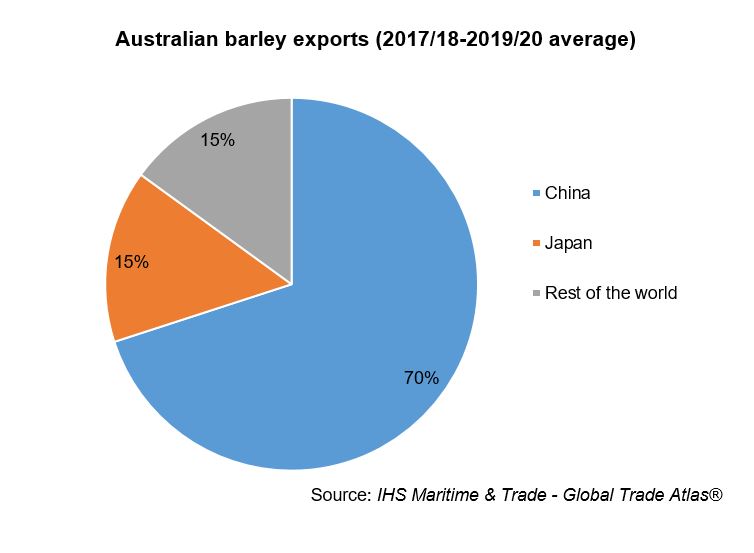
The main export destination for Australian barley is China (around 70% of total Australian barley exports were shipped to China between 2017/18 and 2019/20). However, a dispute between these two nations has led China to place an 80.5% tariff (May 2020) on Australian barley imports making them uncompetitive.
China is a premium market for Australian barley exports.
Top 5 export destinations for Australian barley (2017/18–2019/0 avg)
|
|
Quantity |
Value, £ million |
Unit price £/t |
|
China |
3.28Mt |
558.8 |
170 |
|
Japan |
0.72Mt |
129.2 |
179 |
|
Thailand |
0.33Mt |
54.7 |
168 |
|
Vietnam |
0.13Mt |
25.0 |
195 |
|
United Arab Emirates |
0.06Mt |
11.1 |
181 |
As a result, Australian barley is being redirected to lower value markets such as Saudi Arabia and African markets for use in animal feed. This could potentially cause competition for UK feed barley exports (see below).
Japan accounts for 15% of Australian export market and Thailand around 7% (2017/18-2019/20 average).
According to the Australian Export Grains Innovation Centre (AEGIC), Australian barley exports account for more than 40% of global malting barley trade and 20% of feed barley trade.
As the table above shows, Australian barley imports pale in comparison to the level of exports.
Australian malt (unroasted) exports averaged 646.8Kt (2017/18-2019/20), with over 30% destined for Vietnam.
Australian malt* exports (2017/18-2019/20 average)
|
|
Quantity, Kt |
Value, £ million |
Unit price, £/t |
|
Vietnam |
197.8 |
68.6 |
347 |
|
South Korea |
106.5 |
37.6 |
353 |
|
Japan |
82.0 |
30.3 |
370 |
|
Thailand |
77.9 |
24.6 |
316 |
|
Philippines |
61.2 |
18.0 |
294 |
*HS code 110710
Australia’s domestic and export malt markets have different brewing processes and so the quality of malt required for these markets differs. Approximately, 190Kt of Australian malt is used domestically (Barley Australia).
UK
UK barley production is predominately focused towards the malting and livestock feed sectors. The UK is typically a net exporter of barley. A significant amount of barley is shipped, predominately to EU markets but also to valuable markets in Northern Africa, though these markets have steadied a little in the past few seasons.
UK barley exports (2017/18-2019/20 average)
|
|
Quantity |
Value, £ millions |
Unit price, £/t |
|
Spain |
273.7 Kt |
40.3 |
147 |
|
Netherlands |
248.0 Kt |
39.0 |
157 |
|
Ireland |
172.7 Kt |
27.7 |
160 |
|
Portugal |
151.1 Kt |
22.9 |
151 |
|
Belgium |
89.7 Kt |
15.9 |
177 |
UK malt exports averaged 190.7Kt between 2017/18 and 2019/20, with most of these destined for Japan. In terms of value, however, the US was the biggest market for UK malt exports during this period.
UK malt* exports (2017/18-2019/20 average)
|
|
Quantity |
Value, £ millions |
Unit price, £/t |
|
Japan |
77.2 Kt |
31.9 |
413 |
|
United States |
26.7 Kt |
15.8 |
593 |
|
Ireland |
17.7 Kt |
6.1 |
344 |
|
Vietnam |
13.1 Kt |
4.6 |
348 |
|
Thailand |
10.0 Kt |
3.7 |
371 |
*HS code 110710
Looking at the trade relationship between the UK and Australia, there is negligible trade in barley between the two countries. This is understandable given that they are on opposite sides of the world and both nations have more proximal markets to tap into.
While there is more activity in malt trade between the UK and Australia, it is nothing to get excited about. Between 2017/18 and 2019/20 the UK did not import any malt from Australia but did export an average of 947 tonnes. However, the latter only accounted for less than 1% of total UK malt exports.
Canola/rapeseed
|
Annual production and trade, 2017–2019 average (crop years) |
||
|
|
 |
 |
|
PRODUCTION (3-yr avg) |
2.86 mt |
1.98 mt |
|
TOTAL EXPORTS (3-yr avg) |
Rapeseed: 1.85mt Meal: n/a Oil: 168.3Kt |
Rapeseed: 97.9Kt Meal: 211.4Kt Oil: 196.1Kt |
|
TOTAL IMPORTS (3-yr avg) |
Rapeseed: 1.29Kt Meal: n/a Oil: 20.3Kt |
Rapeseed: 273.1Kt Meal: 196.7Kt Oil: 76.6Kt |
|
Source: USDA FAS PSD database, Defra, HMRC, IHS Maritime & Trade - Global Trade Atlas® |
||
Rapeseed is referred to as ‘canola’ in Australia (and Canada). Australia is usually the second largest global rapeseed exporter, after Canada (small crops in 2018/19 and 2019/20 meant that Ukraine overtook Australia in these years). This is despite the fact that Australia accounts for only 4% of global rapeseed/canola production. Australian typically exports around 70% of its rapeseed production.
EU countries are an important destination for Australian canola, as well as China and Japan.
Top 5 export destinations for Australian canola (2017/18-2019/20 average)
|
|
Quantity |
Value, £ millions |
Unit price £/t |
|
Germany |
630.8Kt |
208.4 |
330 |
|
Belgium |
491.9Kt |
166.8 |
339 |
|
China |
195.0Kt |
69.5 |
357 |
|
Netherlands |
147.6Kt |
51.2 |
346 |
|
Japan |
123.3Kt |
41.5 |
337 |
Australian canola/rapeseed is favoured in the EU as it is non GM (genetically modified). The EU biodiesel industry is a key source of demand for rapeseed, which is crushed to produce oil. Around 6-7 million tonnes of rapeseed oil are used in EU biodiesel production. However, policy changes are moving towards lower consumption of virgin oils for this end-market. Furthermore, the shift towards phasing out diesel vehicles this decade will also affect demand. EU rapeseed oil consumption in food, is fairly stable at around 3 million tonnes, and there is unlikely to be any further substantial growth in this area given that the market is fairly mature.
China is the world’s largest consumer of rapeseed oil in food use (accounting for around 40%). Although, growth in this market has levelled off, China remains a key export destination. Due to its processing capabilities, China mainly imports rapeseed and produces rapeseed oil itself.
The substitutable nature of vegetable oils also means that there is competition from imported palm and soyabean oils, with price usually being the determining factor for many applications.
There is negligible trade for Australian rapeseed meal as the country consumes all that it produces in its domestic animal feed market.
UK
UK rapeseed production has been falling in recent years due to increased technical difficulties with growing the crop. Most UK rapeseed exports are destined for the EU for biodiesel production, although, as mentioned earlier, policy changes are likely to see a fall in demand over the coming decade.
Top 5 export destinations for UK rapeseed 2017/18-2019/20
|
|
Quantity, Kt |
|
Germany |
57.0 |
|
Sweden |
14.4 |
|
Denmark |
9.0 |
|
Czech Republic |
8.6 |
|
Netherlands |
6.4 |
Top 5 import origins for UK rapeseed 2017/18-2019/20
|
|
Quantity, Kt |
|
France |
82.0 |
|
Netherlands |
66.6 |
|
Ukraine |
40.4 |
|
Lithuania |
26.1 |
|
Latvia |
22.0 |
Nowadays, the UK is usually a net-importer of rapeseed which is a result of lower production levels. The UK rapeseed harvest in 2020 is the lowest in at least a decade, meaning that domestic supplies will be tight in the coming crop year and so higher imports are to be expected.
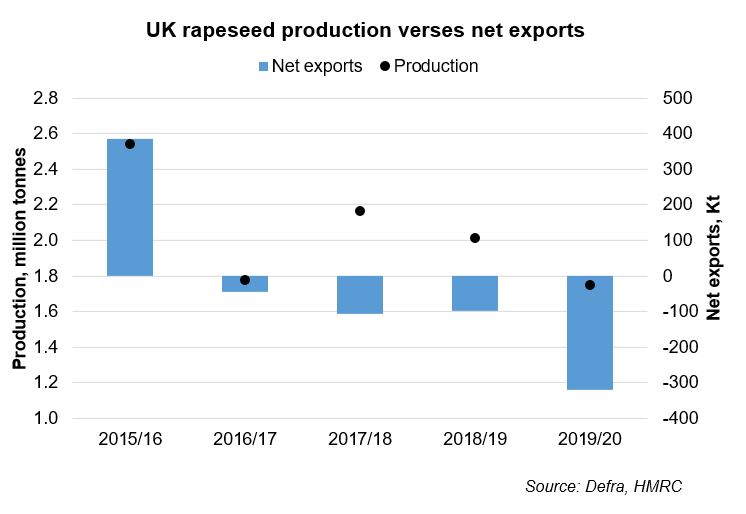
The UK is usually a net exporter of rapeseed oil, with the EU as the main destination. However, the latest trade data for the current crop year (2020/21) shows UK rapeseed oil imports outstripping exports for July to end of November. This is due to much tighter rapeseed supplies as mentioned earlier.
UK rapeseed oil exports 2017/18-2019/20
|
|
Quantity, Kt |
|
Netherlands |
56.0 |
|
Germany |
44.0 |
|
Belgium |
40.5 |
|
Norway |
11.9 |
|
Sweden |
11.1 |
The UK has also exported an average of 4.3Kt of rapeseed oil to China between 2017/19 and 2019/20.
In the past five crop years, the UK has been a net-exporter of rapemeal twice (2017/18 and 2018/19), with the EU as the main destination. Soya bean meal, imported from South America is the main rival of rapemeal in the animal feed market.
UK rapeseed meal exports 2017/18-2019/20 average
|
|
Quantity, Kt |
|
Netherlands |
65.0 |
|
France |
47.1 |
|
Spain |
44.3 |
|
Germany |
29.8 |
|
Ireland |
21.9 |
The EU is also the main origin for UK rapeseed meal imports. It is worth noting that the main UK rapeseed crushing companies have operations in the EU and so shipping material between locations will be reflected in trade data.
UK rapeseed meal imports 2017/18-2019/20
|
|
Quantity, Kt |
|
Belgium |
53.7 |
|
Germany |
38.9 |
|
France |
35.8 |
|
Ireland |
12.3 |
|
Lithuania |
11.2 |
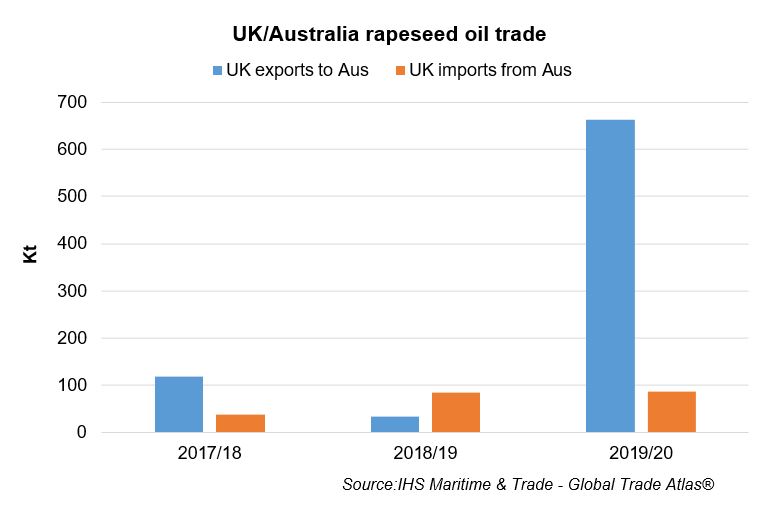
Rapeseed and rapeseed oil trade between the UK and Australia was fairly minimal between 2017/18 and 2019/20. Rapeseed imports from Australia are usually considerable when the UK has a small domestic crop. UK rapeseed imports from Australia in 2016/17 were 121.5Kt and in 2020/21, 148.2Kt of rapeseed had been imported from Australia by April 2021. Trade in rapeseed oil is also fairly subdued, although over 650Kt of UK rapeseed oil was exported to Australia in 2019/20.
This article is part of a series assessing the impacts of signing trade deals with new partners, see below our other analysis on Australia:
Topics:
Sectors:
Tags:


