August 2026 dairy market review

Wednesday, 9 September 2026

Explore the latest August 2026 data on milk production, dairy trade, commodity markets, farmgate milk prices and consumer purchasing trends across the dairy sector.

Milk production

Domestic

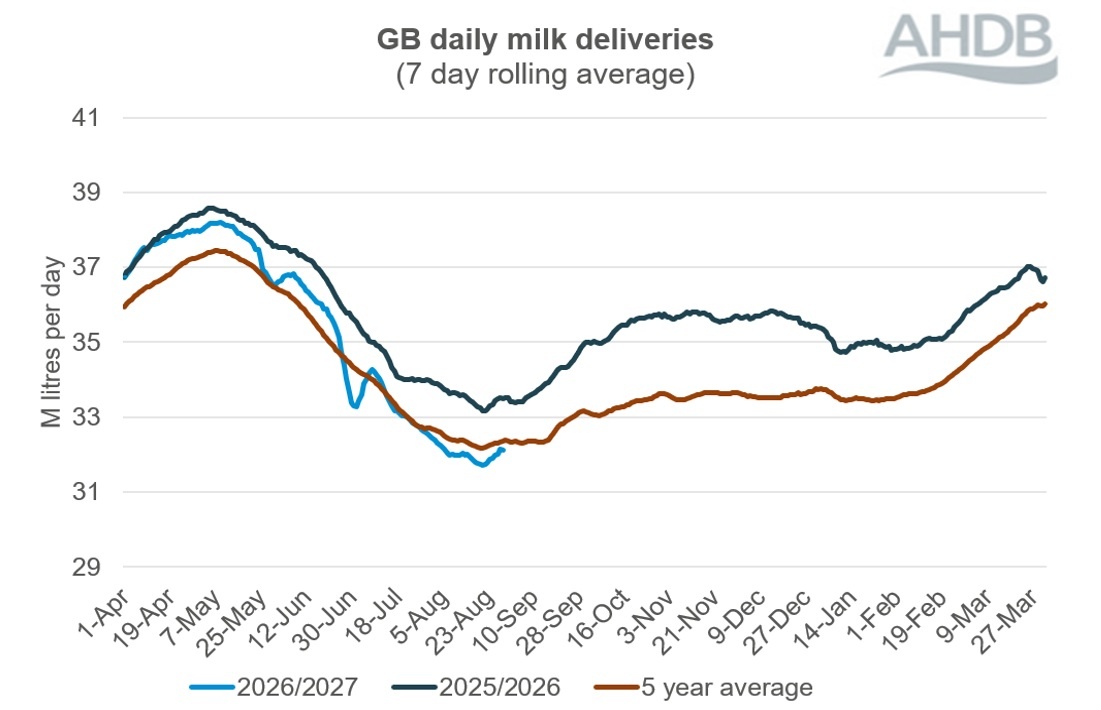
GB milk deliveries in August reduced by an estimated 4.5% year-on-year with milk supplies now falling further as heat stress and drought continues.

Daily deliveries in August averaged 32.00m litres and totalled an estimated 992m litres, a reduction of 46m litres (-4.5%) compared to the previous year. This brings milk year to date (April-August) supplies for GB to 2.5% below 2025 levels.

Dairy economics, including the Milk to Feed Price Ratio (MFPR) have been worsening since Autumn. Although milk price announcements have come through for August and September they were not active in the market at this point.                  

There are a number of further factors that point towards further reductions in milk supplies: bluetongue virus has become endemic in the West Country which affects milk production in infected herds, input costs remain high impacted by the war in the Middle East, feed costs are also pushing up due to global drought and the war in Ukraine. Milk prices will therefore need to compensate, even without support from commodity markets. 

The milking herd has continued to contract. As of 1 July 2026, the GB milking herd stood just under 1.6 million head, down 34,500 head year-on-year. This marks the largest annual decline since January 2021. The youngstock herd stood at 869,000 head, down 36,000 head year-on-year, raising questions if future heifer availability will be enough or if the shift to dairy beef has swung too far.

Figure 1. GB daily milk deliveries

The graph shows milk deliveries in 2026 have fallen below 2025 and 5-yr average levels..

Source: AHDB

Line graph shows GB daily milk deliveries over time that rise in the spring flush and then fall before rising through the autumn. The graph shows that in July the 2026/27 line (the shorter line) continues to fall from the 2025/26 line (at the top) but then dips below the five-year average (the bottom longer line). 

Milk price announcements have seen some further positivity through the summer and into the Autumn and have now seen some fairly substantial rises announced.  The latest Defra farmgate milk price is now around 35ppl on average for July but feed prices have begun to climb.      

AHDB’s latest forecast predicted decline in milk supplies for this milk year with decline beginning after the flush and deepening through the autumn.  However, as a result of the heatwaves and rapidly spreading Bluetongue virus the decline has been more intense than anticipated.  The forecast will be revisited in October.  

Organic milk supplies

GB Organic milk deliveries have been running slightly below last year since May.

Deliveries dipped into year-on-year decline from May 2026 and have remained well below the 5-year average although August to 29th was back by 2.9%. Milk year to date (April to July) volumes are now 1.3% lower, year-on-year.

The recent dip has shown a similar trend to total milk volumes, impacted by heat and dry conditions, albeit with a weaker spring flush.

However, in comparison to the 2021/22 year supplies are still behind by 19%. 

The widening gap between conventional and organic milk prices suggests stronger demand for organic milk and need to maintain organic milk supplies which makes it important for production growth to be maintained. 

Global

  • The latest global production data estimate shows growth in global milk flows continuing across milk-producing regions.
  • Global milk deliveries averaged 816.6 million litres per day in June, an increase of an estimated 21.8 million litres per day (+2.7%) across the selected regions, compared to the same period in the previous year. All regions, with the exception of the UK, recorded an increase.
  • Milk deliveries in the EU averaged an estimated 421 million litres per day in June, an increase of 12.3 million litres per day (+3%) compared to the same month of the previous year (although not all markets had published data at the time of writing).
  • Looking at the EU figure in greater detail, we saw the greatest year on year volume increase from Germany, up 153 million litres (+5.8%) for the month of June, followed by the Netherlands, up by 109 million litres (9.9%).
  • US production was up 8.4 million litres per day (+3%) year-on-year in June. Expansion of the dairy herd has continued to drive the growth. Farm margins have now lowered from strong levels but remain positive, supported by dairy-beef revenue streams.
  • New Zealand deliveries were up by 0.4 million litres per day (+5%) year-on-year in June, into the new milk season with average daily deliveries at 8.9 million litres per day. Farmer confidence continues to be supported by firm milk prices and favourable weather conditions which increased milk flows.
  • Argentina’s deliveries continued to grow, up by 0.5 million litres per day (+1.6%) in June, year-on-year.

Dairy trade Q2

Exports of cheese have continued to grow since the second quarter of 2025 and recorded an all-time high in Q2 2026, mainly driven by an increase to the EU. Export volumes of total cheese increased by 15.3% (+8,000 tonnes) year-on-year.

Powders saw the biggest increase year-on-year in volumes terms, up by 9,400 tonnes (22.2%): bound for both EU nations such as Denmark, France, Germany, Italy, the Netherlands, Poland and Spain, and non-EU nations including Bangladesh, Egypt, Lebanon, Libya, Malaysia, Mexico, Oman, Qatar, Thailand, Vietnam and Yemen.

Conversely, total export volumes of dairy products from the UK for Q2 2026 witnessed the first quarterly decline year-on-year since the decline in Q1 2025.

Exports of dairy products to the EU, saw a major decline of 94,400 tonnes while that to non-EU nations increased marginally by 1,400 tonnes.

This was mainly driven by milk and cream, yogurt, whey and butter.

Conversely, an increase in export volumes of powders and cheese limited the overall decline.

Wholesale markets: August

  • Butter strengthened £130/t to £3,450/t as most fat sold directly as cream
  • Mild cheddar prices moved upwards by £10/t to £3,060 as supplies tighten but less than anticipated
  • SMP strengthened, gaining £110/t over the month for an average of £2,470

We have now experienced a fifth heatwave in summer 2026 which has constrained milk volumes sharply in the UK, particularly in the south. Grass growth is non-existent in places and many farmers are having to feed winter stocks. Milk volumes fell to 4.5% below last years at one point with some processors hit harder than others based on regionality. 

Widespread Bluetongue virus through the South West and increasingly the rest of England and Wales and Southern Scotland is also adding to milk production fears.

These concerns contributed to wholesale prices rising over the 5-week period. Our wholesale prices represent an average price over the 5-weeks.

The latest GDT (Global Dairy Trade) auction results showed some positivity with a change in the index of 0.9% to $3,910/t.  This was driven primarily by SMP which rose by 5.3% to $3,695 conttinuing an upwards run. Conversely, WMP was flat at -0.1% whilst cheddar dropped 6.6%. On the fats side, butter fell by 0.8% and AMF by -1.3%. 

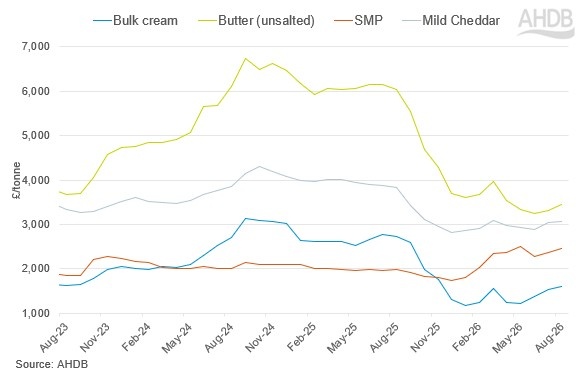
Figure 1. UK wholesale prices from early 2023 to July 2026

Line graph showing UK dairy wholesale prices.

Figure 1 shows average UK wholesale prices from early 2023 to August 2026 for bulk cream, butter (unsalted), skimmed milk powder (SMP) and mild Cheddar, measured in £s per tonne.

Butter prices remain consistently higher than the other products, although are now at low levels but have nudged up in last period. All four products show a steep decline from late summer 2025 into early 2026, followed by modest recovery in February and March 2026 with butter and cheddar declining in April to June, cream rising in the last two months and mild cheddar and SMP also gaining in the past month. 

Farmgate milk prices 

The latest published farmgate price was for July 2026 and was announced by Defra as being  35.00ppl, up 0.62 pence on the previous month

Latest announced farmgate prices saw some uplifts in the period.

Aligned liquid contracts held mostly steady. Muller Co-op Dairy group and Tesco made no change to their price after an increase last month. Muller M&S held on to their price whilst Waitrose increased their price by 1.00ppl. Sainsbury’s was the only exception to have made a price reduction for another month and price declined by a scant 0.06ppl.

Non-aligned liquid contracts were all positiveCrediton Dairy made a positive announcement for another consecutive month, increasing their price by 1.50ppl. Muller and Payne’s Dairies increased their price by 0.50ppl and 3.00ppl respectively. Pembrokeshire Creamery increased their price by 0.69ppl. This is the second consecutive month of increases in price.

Cheese contracts on the AHDB League table continued the growth this month. Price increases varied between 1.00ppl to 2.25ppl. South Caernarfon Creameries announced the largest increase of 2.25ppl for the month. Belton Cheese, First Milk Manufacturing and Leprino Food increased their price by 2.00ppl each. Lactalis made a positive announcement of 2.07ppl while Barbers have increased their price by 1.50ppl. Saputo and Wensleydale Creamery made a positive announcement for the fourth consecutive month increasing their price by 1.00ppl and 1.83ppl respectively.

Movements in manufacturing contracts were in line with cheese contracts. UK Arla Farmers Manufacturing increased for the sixth consecutive month and rose by 0.89ppl. Pattemores Dairy Ingredients grew by 2.00ppl. Meadow also continued the positive run and increased their price by 2.00ppl.

Retail demand

During the 12 weeks ending 8 August 2026, cows’ dairy volumes were flat, year on-year, while spend grew by 1.9% driven by price increases.

Cows' milk

Milk volumes saw a 1.3% decline in volumes purchased year-on-year1, while spend saw a 1.2% increase, driven by a 2.6% increase in average prices paid.

Declines were seen for semi-skimmed and skimmed. Whole milk continued to see volume growth, with a 1.4% increase year-on-year, this is due to more buyers and more litres per occasion purchased.

Cows' cheese

Cow cheese remained in volume growth, seeing a 2.5% increase year-on-year1. Spend grew by 0.6% during this period, benefitting from a 1.8% decrease in average prices.

Other cows’ cheese (+13.0%), specialty and continental (+4.1%), snacking (+3.5%) and processed (+1.1%) saw growth. This is particularly driven by cottage cheese which saw a 43% increase in volume. This growth offset declines in stilton and British blue, British regionals and cheddar. Cheddar saw a decrease of 839kg due to a decrease in buyers. Extra mature slices (-16.1%), reduced fat/functional (-12.7%) and grated mild (-11.6%) also saw large declines.

Cows' butter

Butter saw a 1.5% decrease in volumes purchased year-on-year¹. Spend saw a 4.6% decrease, mainly driven by average price reductions of 3.2% year-on-year, ¹ with decreases in wholesale price feeding through to shoppers, as we predicted back in December.

Block butter continues to be the only subcategory to see volume growth (+4.5%), as the number of buyers increases by 4.3%. However, this growth was not enough to offset the decline in butter spread volumes (-4.1%).¹ Butter saw a 2.6% decrease in volumes purchased year-on-year1. Spend saw a 6.7% decrease year on year, and average prices paid decreased by 4.2%.

Block butter continues to be the only subcategory to see volume growth (+1.8%), this growth is likely to be due to consumers wanting less ultra processed and more natural foods. However, this growth was not enough to offset the decline in cow butter spread volumes (-4.6%).

Cows’ yoghurt, yoghurt drinks and fromage frais

Cows’ yogurt, yogurt drinks and fromage frais volumes continue to see growth (+7.1%), with spend increasing 9.3% year-on-year1. This growth is due more kilos per occasion purchased. Averages prices paid grew 2.1%.

Cows’ standard plain yogurt (+19.7%), healthy (+15.1%) and fat free (+9.7%) were among the strongest performing subcategories.

Cows' cream

Cream volumes fell by 1.9% year-on-year, with a 2.5% increase in average prices paid, and a 0.5% increase in spend1. Growth was seen in double (+1.3%) and whipping (+1.2%).

See the full data and these insights visualised on our GB household dairy purchases retail dashboard.

¹ NIQ Homescan POD, Total GB, 12 w/e 8 August 2026   


Sign up to receive the latest information from AHDB.

While AHDB seeks to ensure that the information contained on this webpage is accurate at the time of publication, no warranty is given in respect of the information and data provided. You are responsible for how you use the information. To the maximum extent permitted by law, AHDB accepts no liability for loss, damage or injury howsoever caused or suffered (including that caused by negligence) directly or indirectly in relation to the information or data provided in this publication.

All intellectual property rights in the information and data on this webpage belong to or are licensed by AHDB. You are authorised to use such information for your internal business purposes only and you must not provide this information to any other third parties, including further publication of the information, or for commercial gain in any way whatsoever without the prior written permission of AHDB for each third party disclosure, publication or commercial arrangement. For more information, please see our Terms of Use and Privacy Notice or contact the Director of Corporate Affairs at info@ahdb.org.uk  © Agriculture and Horticulture Development Board. All rights reserved. 

×