Do regenerative practices save costs? Grain market daily
Tuesday, 1 October 2024
Market commentary
- UK feed wheat futures (Nov-24) ended only slightly changed yesterday up £0.05/t, closing at £182.60/t. The May-25 contract ended the session at £197.00/t, up £0.25/t from Friday’s close.
- Domestic wheat futures moved up yesterday with support from Chicago and Paris wheat futures. Weather risk in northern hemisphere for the winter sowing campaign supported futures prices in Paris yesterday, along with higher maize prices.
- Nov-24 Paris rapeseed futures closed at €470.00/t yesterday, up €0.50/t over the session. The May-25 contract gained €0.75/t over the same period, to close at €482.00/t.
- European rapeseed prices followed support in the US soyabean market yesterday on the back of lower than market expected ending stocks in US as of 1 of September 2024.
- Australia would be the potential winner in canola (rapeseed) trade flows to China, if China imposes tariffs on Canadian imports of the oilseed, but Beijing would need to check their worries about the blackleg fungus.
Do regenerative practices save costs?
Regenerative practices have gained popularity within the UK over recent years. Aside from the environmental and biodiversity benefits, many of the practices are also thought to improve profitability.
Within this series of two articles, we will look at UK wheat data, collected through the AHDB benchmarking tool, Farmbench. We will explore the impact a selection of practices often included in regenerative systems have on costs, profitability and production.
There are 241 harvest 2023 winter wheat enterprises recorded in this analysis, including milling and feed varieties.
Each farm was asked which of fifteen practices they carried out (shown below) and split into the following groups: ‘High’ (9–14 practices), ‘Medium’ (5–8 practices), and ‘Low’ (0–4 practices).

- Composting farmyard manure
- Catch cropping
- Cover cropping
- Maximum 10% cultivation per year
- Minimising fungicides
- Nil insecticide use
- Reducing all synthetic inputs
- Using organic manures
- Multi-variety blends
- Adding livestock into the rotation
- Growing a long and broad rotation
- 90% no tillage
- Reducing all inorganic fertiliser use
- Companion cropping
- Including herbal leys in the rotation
As may be expected, certain practices were more popular within each group.
Establishing cover crops, applying organic manures and growing a long and broad rotation were each taken up by more than 63% of the enterprises.
For the ‘low’ group (0-4 practices), these practices made up a larger percentage of the practices they used.
The ‘high’ group (9-14 practices) used more practices relating to reduced tillage and lowering inorganic fertiliser use than the other groups.
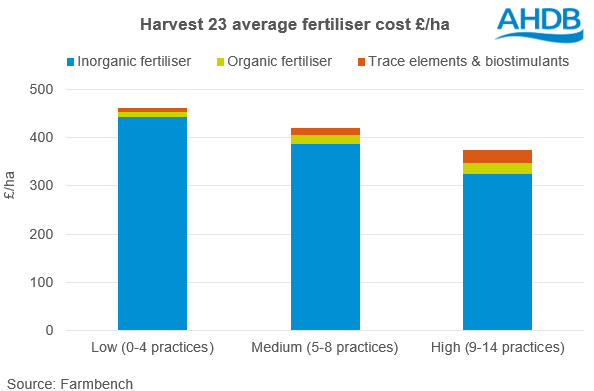
As would be expected, the focus the ‘high’ group had on using less synthetic fertiliser, resulted in lower inorganic fertiliser costs than the ‘medium’ (5-8 practices) and ‘low’ groups, as shown in Figure 1.
The average wheat crop in the ‘high’ group tended to spend £29/ha more on organic manure and trace elements, including biostimulants, but made larger savings by cutting their inorganic fertiliser use by 48kg/ha of nitrogen.
This resulted in an inorganic fertiliser saving of £117/ha in comparison to the ‘low’ group, and an overall fertiliser saving of £88/ha.
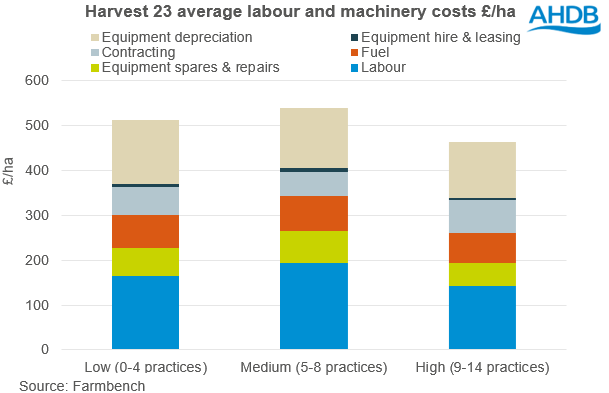
This reduction in fertiliser use also likely contributes to the slightly lower overhead costs, such as labour and fuel, in the ‘high’ group. However, other practices the group used could also contribute to this cost saving.
Figure 1. Average fertiliser costs for each category of farm

Another key difference in the systems was the use of low or no till cultivation.
The ‘high’ group used these practices more than the other groups. They spent the least on labour and machinery costs overall, saving up to £76/ha in comparison to the ‘medium’ group, as shown in Figure 2.
Aside from the clear cost savings by reducing cultivations, such as to fuel spend, the ‘high’ group made savings in their business structure.
The ‘high’ group are keeping less kit on farm, reducing their depreciation costs, and employing more contractors.
Contracting was the only machinery and labour cost which the ‘high’ group spent more than the ‘medium’ and ‘low’. This may partially be due to less machinery needed within low tillage systems but could also relate to a tendency to hire in specialised equipment from other businesses.
Figure 2. Average labour and machiner costs for each category of farm

The average wheat enterprise within the ‘high’ group had the lowest total cost of production at £1312/ha, benefitting from the key cost savings explored in this article.
The ‘medium’ and ‘low’ groups had a similar cost of production, £1451/ha and £1452/ha respectively, meaning that the ‘high’ group had saved 9.6% of costs in comparison to the other groups.
Look out for the next article where we will explore how these groups differ in yields, income and as such, profitability.
Sign up to receive the latest information from AHDB.
While AHDB seeks to ensure that the information contained on this webpage is accurate at the time of publication, no warranty is given in respect of the information and data provided. You are responsible for how you use the information. To the maximum extent permitted by law, AHDB accepts no liability for loss, damage or injury howsoever caused or suffered (including that caused by negligence) directly or indirectly in relation to the information or data provided in this publication.
All intellectual property rights in the information and data on this webpage belong to or are licensed by AHDB. You are authorised to use such information for your internal business purposes only and you must not provide this information to any other third parties, including further publication of the information, or for commercial gain in any way whatsoever without the prior written permission of AHDB for each third party disclosure, publication or commercial arrangement. For more information, please see our Terms of Use and Privacy Notice or contact the Director of Corporate Affairs at info@ahdb.org.uk © Agriculture and Horticulture Development Board. All rights reserved.


