High excess winter rainfall already recorded across the UK
Tuesday, 13 February 2024
AHDB has published interim excess winter rainfall (EWR) data to help farmers fine-tune nitrogen applications to crops.
The data is based on the first four months (October–January) of the full EWR period (October–March).
Extreme rainfall during this period means that many parts of the UK are already in the highest EWR category.
After accounting for water lost through crops, some areas remain in the moderate EWR category, with a few still categorised as low. These are mainly in and around the East of England region.
However, with two months of the EWR period remaining and an unsettled start to February, it is highly likely that almost all the UK will be categorised as having high EWR by April.
The EWR categories correspond to three look-up tables in section 4 of the AHDB Nutrient Management Guide (RB209), which can be used to estimate a field’s soil nitrogen supply (SNS) index and determine recommended nitrogen rates.
What is EWR?
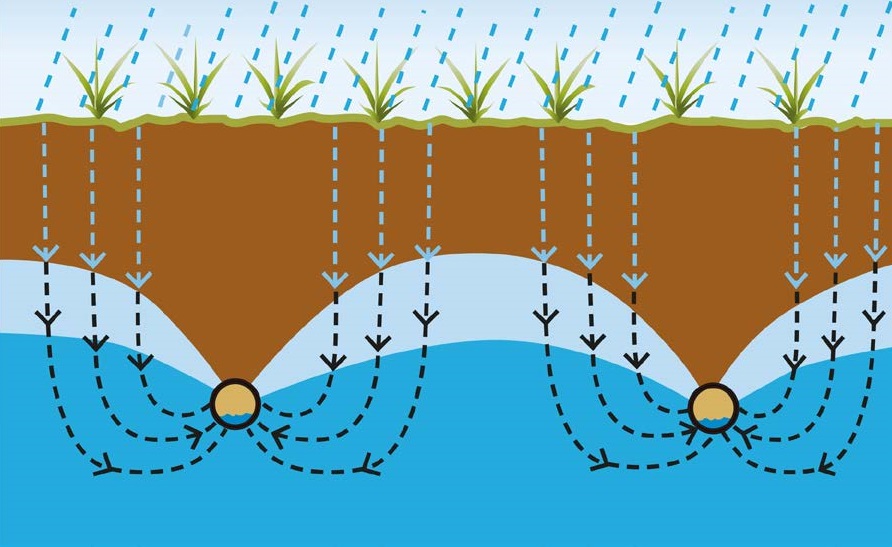
EWR reflects the amount of rainfall the land receives after the soil profile becomes fully wetted in the autumn (field capacity) and before the end of drainage in the spring. It can be used to indicate how much nitrate has leached into drainage water.
AHDB uses Met Office data to map EWR across the UK (199 40 km by 40 km grid) using three categories:
Low: less than 150 mm EWR
Moderate: 150 to 250 mm EWR
High: over 250 mm EWR
Two map types are created: for bare soil and for cropped land. The latter maps (for winter wheat, winter barley and winter oilseed rape) account for water lost through the crop.

Emma Willis, who manages nutrient management research at AHDB, said:
The EWR period has already seen ten named storms and relentless low-pressure Atlantic systems resulting in widespread saturated ground and flooding. The high levels of rainfall recorded in the interim EWR UK map is unsurprising.
In addition to rainfall, RB209’s look-up tables also consider the impact of soil type and the previous crop on soil nitrogen supply. Table 4.5 in Section 4 provides the SNS indices associated with high excess winter rainfall.
The final EWR 2023/24 data will be published in April.
To plan nitrogen applications, use the nitrogen calculator, follow RB209 guidance and access the EWR maps on the AHDB website: ahdb.org.uk/ewr

Topics:
Sectors:
Tags:


