The wider impact of heatwaves on dairy farms: milk composition and hygiene levels

Thursday, 24 September 2026

While GB milk production has been severely impacted by heat stress in cows, the summer of heatwaves has caused a number of secondary impacts, extending beyond milk volumes.

Key points 

  • Actual milk solids output has fallen year-on-year, as lower milk volumes outweighed marginal growth in milk composition
  • Higher SCC and bactoscan levels highlight the negative effect of excessive heat on milk hygiene levels
  • Heat-related herd health challenges, disease risks and higher feed costs have added to the cost of production

Milk composition

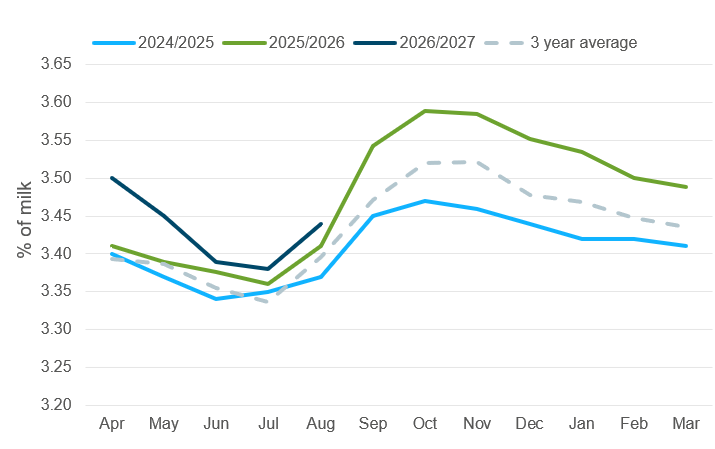
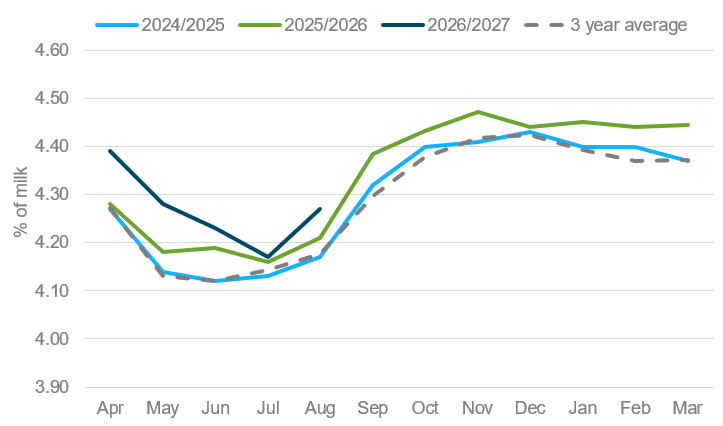
UK milk composition levels have been particularly high over the past 18 months and remained marginally higher as a percentage of milk volume in August 2026 compared to 2025, according to Defra data. This has been the result of better genetics and better nutrition as returns improved. However, those gains slowed during the summer, following strong growth. Additionally, total milk volumes in the UK were down by 3.5%, meaning that actual volumes of butterfat and protein available to the market were lower, by 1.9% and 2.7%, respectively.

With heat stress and drought impacting farms from May through the summer of 2026, we have seen continuation of the lower volumes coming into September, thereby affecting solids output.

Due to lack of forage, some farmers may be feeding more concentrates and winter rations, increasing the cost of producing these solids, and using resources which are needed to sustain production and stocking rates through the winter.

Figure 1. Average UK protein content

Average UK protein content

Source: DEFRA

Figure 1 is a line graph which shows monthly average protein levels in UK milk for 2024/2025 (light blue line), 2025/2026 (green line), 2026/2027 (dark blue line) and the 3-year average (grey dotted line). The X axis spans the milk year from April – March.

Figure 2. Average UK butterfat content

UK average butterfat content

Source: DEFRA

Figure 2 is a line graph which shows monthly average butterfat levels in UK milk for 2024/2025 (light blue line), 2025/2026 (green line), 2026/2027 (dark blue line) and the 3-year average (grey dotted line). The X axis spans the milk year from April – March

Milk Hygiene levels

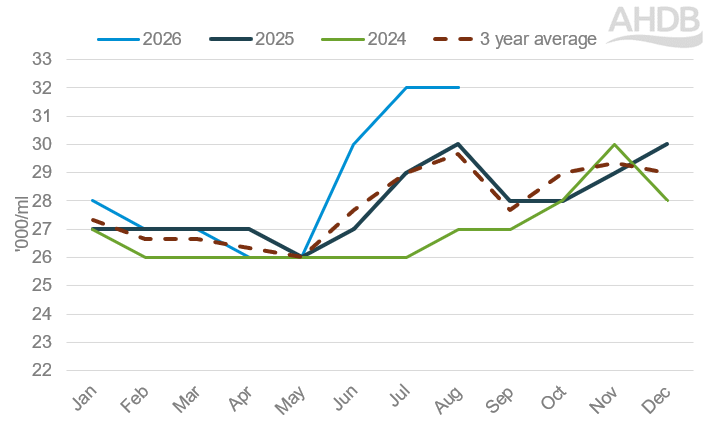
Milk hygiene levels have also been affected. Recent months brought GB bactoscan levels above the three-year average and 2025 levels.

In June and July, bactoscan levels saw a sharp increase, up by 10-11% year-on-year. August levels remained at an average of averaged 32,000/ml, which is 2,000 higher than the same month last year. These increases coincided with the extreme temperatures.

Figure 3. Average GB bactoscan levels

Average GB bactoscan level

Source: DEFRA

Figure 3 is a line graph showing average GB milk bactoscan levels ('000/ml) by month for 2024 (green), 2025 (dark blue), 2026 (light blue) and the three-year average (brown dotted). The X axis spans from January – December

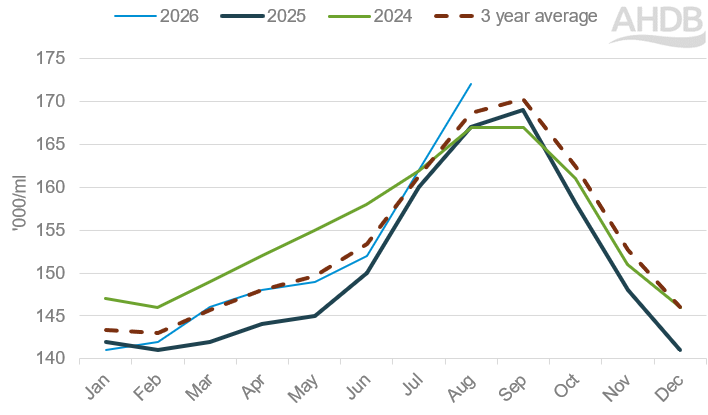
Somatic cell count (SCC) changes appear to have been less dramatic at first, having remained just below the three-year average in the early summer months, until a larger increase in August.

In August, SCC levels averaged 172,000/ml, which is 10,000 higher than the previous month and 5,000 higher than the same month last year.

Figure 4. Average GB somatic cell count levels

Average GB SCC level

Source: DEFRA

Figure 4 is a line graph showing average GB milk somatic cell count levels ('000/ml) by month for 2024 (green), 2025 (dark blue), 2026 (light blue) and the three-year average (brown dotted). The X axis spans from January – December

An increase in these milk hygiene parameters may decrease milk cheques, as well as increase the cost of processes. They also represent an increase in other expensive impacts on farm, such as mastitis.

Additional on-farm costs linked to the heatwaves

Impacts will vary by farm system and region. Potential examples of additional costs and challenges arising from the heatwaves include:

  • Increased feed costs and concentrate usage as forage levels are severely challenged
  • Housing cattle and restricted field access, to reduce walking distances to parlour
  • Increased labour requirements to address heat-related challenges
  • Increased energy, water and infrastructure costs for cooling cattle
  • Higher veterinary costs
  • Reduced cow fertility, lasting long after temperatures reduce. Knock on implication to milk production and dairy heifer replacements and dairy-beef availability.
  • Increased disease risk, as warmer weather is more habitable for disease vectors. The continued spread of Bluetongue is of particular concern. Farmers are encouraged to be prepared for further outbreaks.

What do these heat pressures mean for markets?

UK and European wholesale markets and spot milk prices have reacted. Upwards price movements are supporting farmgate milk prices, but (especially with fewer litres being produced), many contracts still fall short of the increasing cost of production.

Milk prices are rising ahead of commodity markets in an effort to boost surety of supply in the coming months.

August milk volumes continued to see further contraction, despite supplies increasing globally. Considering this, UK trade competitiveness may be reduced.

With a ‘Super El Niño’ suggested, the forecast is at risk of more abnormal weather. Both adaptation at farm level and economic incentives will be necessary to secure future dairy supplies.

AHDB support for farmers: Heatwave pressures on livestock farmers and how we're helping build resilience


Sign up to receive the latest information from AHDB.

While AHDB seeks to ensure that the information contained on this webpage is accurate at the time of publication, no warranty is given in respect of the information and data provided. You are responsible for how you use the information. To the maximum extent permitted by law, AHDB accepts no liability for loss, damage or injury howsoever caused or suffered (including that caused by negligence) directly or indirectly in relation to the information or data provided in this publication.

All intellectual property rights in the information and data on this webpage belong to or are licensed by AHDB. You are authorised to use such information for your internal business purposes only and you must not provide this information to any other third parties, including further publication of the information, or for commercial gain in any way whatsoever without the prior written permission of AHDB for each third party disclosure, publication or commercial arrangement. For more information, please see our Terms of Use and Privacy Notice or contact the Director of Corporate Affairs at info@ahdb.org.uk  © Agriculture and Horticulture Development Board. All rights reserved. 

×