- Home
- Beef 2030 supply forecasts: Results
Beef 2030 supply forecasts: Results
We forecast 2030 figures and percentage change compared with 2023 actual data (the latest available) by scenario. We then present graphs showing actual and forecast trends since 2018.
Baseline scenario
| Measure | 2030 forecast | Change versus 2023 data | |
|---|---|---|---|
| % | No. | ||
| Dairy herd (thousand head) | 1,502 | -1.2 | -18 |
| Suckler herd (thousand head) | 993 | -10.9 | -121 |
| Prime cattle slaughter (thousand head) | 1,567 | -6.3 | -105 |
| Cow slaughter (thousand head) | 471 | -4.4 | -22 |
| Beef production (thousand tonnes) | 691 | -6.1 | -45 |
Source: AHDB
Best-case scenario
| Measure | 2030 forecast | Change versus 2023 data | |
|---|---|---|---|
| % | No. | ||
| Dairy herd (thousand head) | 1,532 | +0.8 | +12 |
| Suckler herd (thousand head) | 1,049 | -5.9 | -65 |
| Prime cattle slaughter (thousand head) | 1,580 | -5.5 | -91 |
| Cow slaughter (thousand head) | 482 | -2.1 | -11 |
| Beef production (thousand tonnes) | 698 | -5.2 | -38 |
Source: AHDB
Worst-case scenario
| Measure | 2030 forecast | Change versus 2023 data | |
|---|---|---|---|
| % | No. | ||
| Dairy herd (thousand head) | 1,457 | -4.1 | -63 |
| Suckler herd (thousand head) | 940 | -15.6 | -174 |
| Prime cattle slaughter (thousand head) | 1,551 | -7.2 | -121 |
| Cow slaughter (thousand head) | 458 | -7.0 | -34 |
| Beef production (thousand tonnes) | 681 | -7.5 | -56 |
Source: AHDB
Best-case + scenario
| Measure | 2030 forecast | Change versus 2023 data | |
|---|---|---|---|
| % | No. | ||
| Dairy herd (thousand head) | 1,554 | +2.2 | +34 |
| Suckler herd (thousand head) | 1,087 | -2.4 | -27 |
| Prime cattle slaughter (thousand head) | 1,638 | -2.0 | -33 |
| Cow slaughter (thousand head) | 490 | -0.6 | -3 |
| Beef production (thousand tonnes) | 720 | -2.2 | -16 |
Source: AHDB
Dairy and suckler cow breeding herds (all scenarios)
Size of GB dairy herd 2018–2030
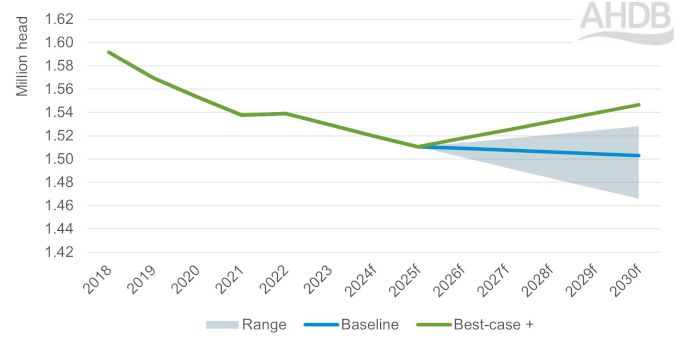
f = forecast
Source: Defra, AHDB
Prime cattle slaughter (all scenarios)
In the baseline scenario, annual prime cattle slaughter levels maintain a downwards trajectory through the forecast period, based on the current rate of contraction in the breeding herds.
Despite the continuous reduction in the number of cows in recent years, the level of prime cattle slaughter has stayed relatively strong. This has partly been influenced by rising numbers of beef cattle being born to the dairy herd, offsetting reductions in suckler-born calves. However, data from the British Cattle Movement Service (BCMS) suggests that this growth in dairy-beef calf registrations has slowed so far in 2024.
Size of GB suckler cow herd 2018–2030
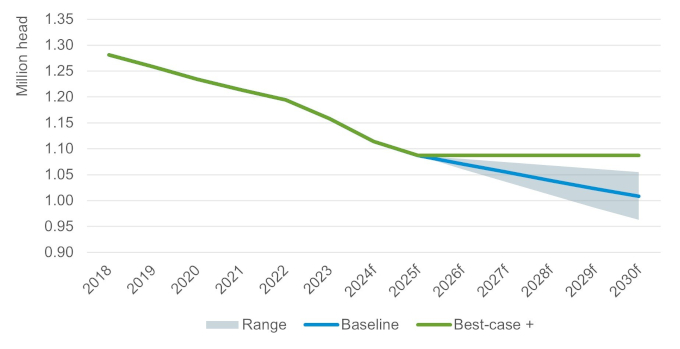
f = forecast
Source: Defra, AHDB
GB prime cattle slaughter 2018–2030
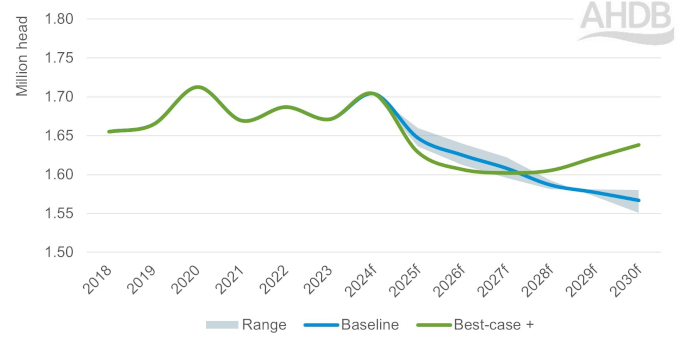
f = forecast
Source: Defra, AHDB
In the worst-case scenario, cattle slaughter is maintained at a higher rate than the baseline until 2028, as more heifers are processed. However, by 2030 the reduction in slaughter is steeper than the baseline due to an accelerated contraction in breeding female numbers.
The best-case scenario, by contrast, sees prime cattle slaughter levels running below the baseline until 2028, as more heifers are retained for breeding. However, more stable slaughter levels are projected between 2028 and 2030 as the breeding herd stabilises.
The best-case + scenario assumes that the average rate of growth seen in the number of calves being born to the national cow herd continues through the forecast period, supported by further growth in dairy-beef numbers and improvements in mortality rates. This would lead to some recovery in slaughter cattle numbers from 2028 onwards but not back to 2023.
Cow slaughter (all scenarios)
In all scenarios, cow slaughter is calculated based on applying current average cull rates to changes in the breeding herd.
GB cow slaughter 2018–2030
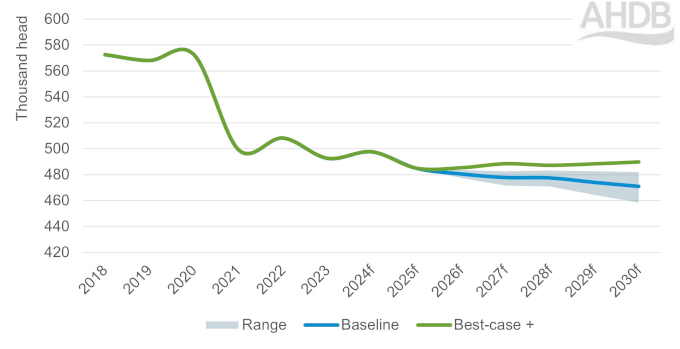
f = forecast
Source: Defra, AHDB
GB beef production 2018–2030
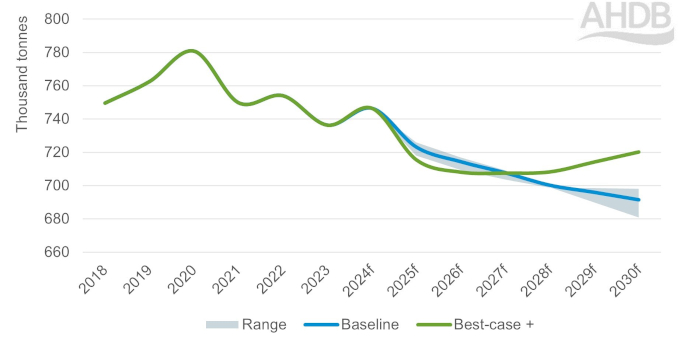
f = forecast
Source: Defra, AHDB
Continue reading about the analysis
Methodology and the four scenarios
How beef meat production in Great Britain may change by 2030

