EU cattle population falls again in December 2025 as breeding herd continues to shrink

Monday, 10 August 2026

The latest data shows that the EU cattle herd continued to contract in 2025, although the decline slowed considerably as strong cattle prices reduced the pressure on producers to cut numbers.

Key points

  • The European Union’s live bovine population stood at 71.58 million head in 2025, 9.7% lower when compared to 2015
  • The European Union’s dairy herd totalled 19.02 million head, down 1.1% year-on-year
  • The number of animals under one year old stood at 22.03 million head, a 0.3% increase year-on-year, suggesting the decline in the herd may be stabilising, although from a historically low base
  • France remains comfortably the EU's largest cattle producer, accounting for 22.7% of the total herd at 16.24 million head
Image of staff member Adam Chowdry

Adam Chowdry

Analyst (Livestock)

See full bio

Live cattle population

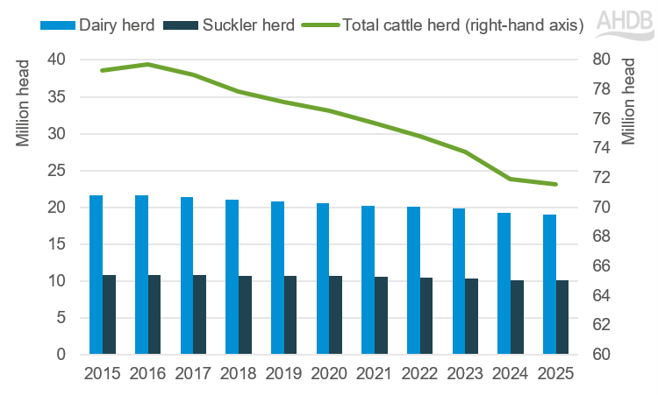
The European Union’s live cattle population stood at 71.58 million head in 2025, according to the latest Eurostat data. That is 0.4% (313,000 head) lower than a year earlier and leaves the herd 9.7% (7.7 million head) smaller than it was in 2015.

The 2025 figure extends an unbroken run of annual declines. Having peaked at 79.7 million head in 2016, the EU-27 herd has contracted every year since. The pace of the decline eased in 2025, following a steeper 2.5% fall between 2023 and 2024.

Additionally, the sharp reductions seen in 2024 may have already completed much of the sector's adjustment, resulting in tighter supplies and a more modest decline in 2025.

Figure 1. EU Cattle population, 2015–2025

Source: Eurostat

Figure 1 shows a combined chart which shows that the dairy, suckler and total cattle herd have declined since 2015. 

Breeding herd signals further tightening of supply

The clearest forward indicator lies in the cow herd, which sets the size of the future calf crop. The EU's total cow herd fell to 29.10 million head in 2025, down from 32.45 million in 2015 – a decline of 10%.

But the dairy and suckler herds are moving at different speeds. The dairy herd, at 19.02 million head in the 2025 data set, was down by 1.1% on the year and has shrunk by 12.2% since 2015, as continued productivity gains allow fewer cows to produce more milk. Dairy cows still account for around 65% of the EU cow herd.

On the other hand, the suckler herd, at 10.08 million head, has proved more resilient: it is down 6.6% over last the decade and held relatively flat year-on-year in 2025.

More telling still is the replacement pipeline. The number of heifers aged one to two years old, which can provide an indication of the future breeding herd, fell 1.8% on the year to 9.71 million head and is down 11% since 2015. With fewer replacements coming through, the scope for cow numbers to stabilise in the near term is limited.

Younger cattle hint at tentative stabilisation

The number of animals under one year old edged up 0.3% to 22.03 million head, a rare increase against the broader downtrend, though from a low base and one that should not be over-interpreted.

By contrast, cattle aged one to two years old, which feed most directly into the prime slaughter pipeline over the coming year, fell 1.2% to 14.30 million head. This band has contracted by 11% since 2015, the steepest fall of any age group over the decade, pointing to continued tightening of prime cattle availability through 2026.

Animals aged two years and over, the largest age band at 35.26 million head, slipped 0.6%.

Contraction concentrated in the traditional western herds

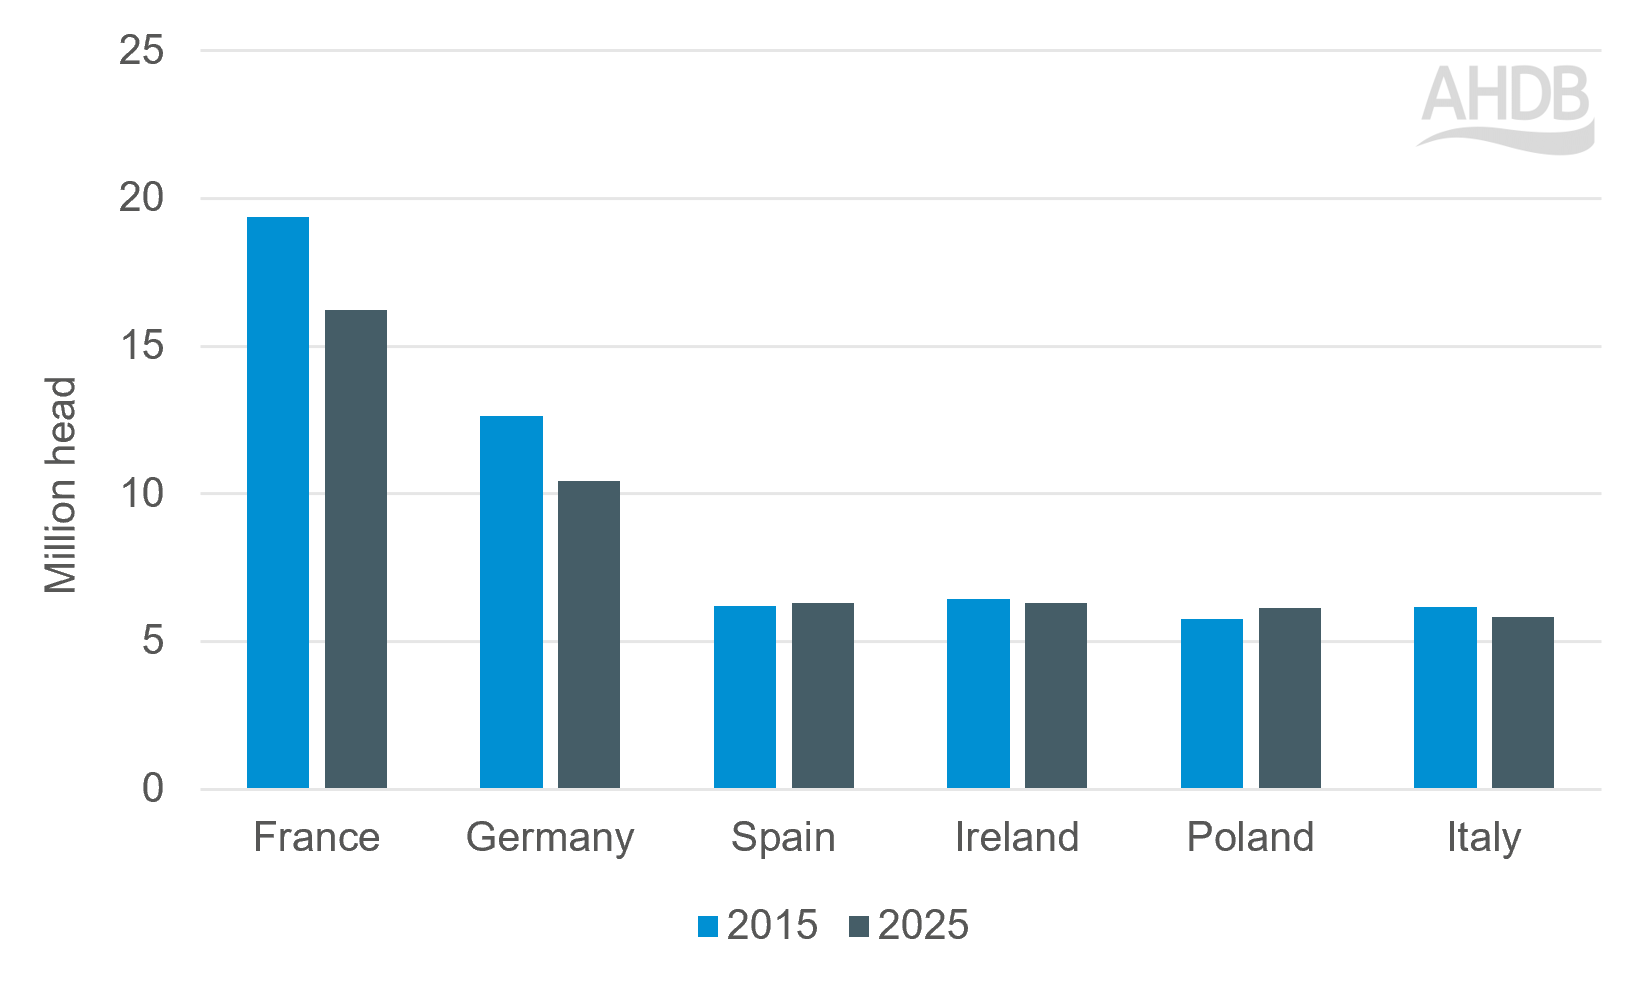
France remains comfortably the EU's largest cattle producer, accounting for 22.7% of the total herd at 16.24 million head, followed by Germany at 14.6% (10.42 million). Spain and Ireland each hold an 8.8% share, with Poland (8.6%) and Italy (8.1%) close behind. The five largest herds together account for more than 60% of the EU total.

The national trajectories, however, diverge sharply. The decade-long contraction has been driven overwhelmingly by the traditional large herds of northwestern Europe: France's herd is down 16.2% since 2015, Germany's 17.5%, the Netherlands' 17.8% and Belgium's 15.0%. Against this, Spain (+1.9%) and Poland (+6.6%) have expanded, with growth in Poland supported by government and CAP-backed investment in the sector. As a result, the centre of gravity of EU cattle production has shifted south and east.

Figure 2. Cattle population of selected European union countries in 2015 and 2025

Source: Eurostat

Herd composition varies just as widely. Germany, the Netherlands, Poland and Denmark run predominantly dairy herds, whereas France sits on the EU's largest suckler herd: 3.63 million beef cows against 2.98 million dairy cows, underpinning its position as the bloc's principal source of beef. 

What it means for the UK

For the UK, the direction of the EU herd matters mainly through trade. The EU, and Ireland in particular, is by far one of the most important sources of imported beef on the UK market, as well as a key competitor and export destination. A structurally smaller EU herd, with a breeding base that continues to shrink, points to tighter European beef availability and a firmer supply and demand balance, broadly supportive of farmgate prices on both sides of the Channel.

The near-term signals are more finely balanced. A marginally larger young population suggests calf supply may be steadying even as the mature herd contracts.


Sign up for regular updates

You can subscribe to receive Beef and Lamb market news straight to your inbox. Simply fill in your contact details on our online form.

Visit the Keep in touch page

While AHDB seeks to ensure that the information contained on this webpage is accurate at the time of publication, no warranty is given in respect of the information and data provided. You are responsible for how you use the information. To the maximum extent permitted by law, AHDB accepts no liability for loss, damage or injury howsoever caused or suffered (including that caused by negligence) directly or indirectly in relation to the information or data provided in this publication.

All intellectual property rights in the information and data on this webpage belong to or are licensed by AHDB. You are authorised to use such information for your internal business purposes only and you must not provide this information to any other third parties, including further publication of the information, or for commercial gain in any way whatsoever without the prior written permission of AHDB for each third party disclosure, publication or commercial arrangement. For more information, please see our Terms of Use and Privacy Notice or contact the Director of Corporate Affairs at info@ahdb.org.uk  © Agriculture and Horticulture Development Board. All rights reserved. 

×