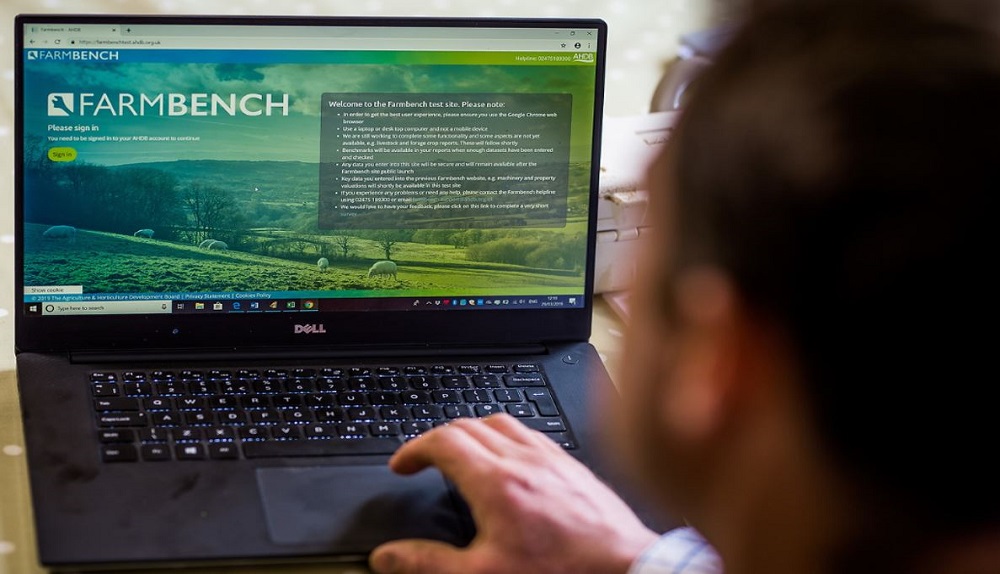
Farmbench: An icebreaker for business
Thursday, 5 September 2024
Is your business trying to tell you something? You can use Farmbench to ‘listen’ and find ways to improve your farm’s profitability. Julie Clark explains how.
In 2017, we launched a whole-farm benchmarking tool called Farmbench, which replaced the crop-specific CropBench.
Thousands of AHDB levy payers have now entered their data into the secure, free-to-use online tool.
Today, it is a rich, robust source of anonymised farm-performance data, which can reveal how any farm compares with similar businesses. It can also highlight areas for improvement and guide a farm’s direction.
Breaking the ice
Although it is possible to ‘go it alone’ with Farmbench, the most valuable lessons are often learned among peers.
There are about 40 AHDB-supported Arable Business Groups (ABGs) in the UK. At these groups, Farmbench reports provide excellent icebreakers for discussions. Together, attendees get to grips with production costs, learning how each enterprise contributes to overall business profitability.
No topic is off the table either, with the debate driven by group interests. Common topics include fertilisers and machinery. For example, members review their fertiliser application strategies or determine whether it would pay to use contractors (instead of using their own machinery). This season, a hot topic has been the Sustainable Farming Incentive (SFI).
Business benefits
Almost 300 people attended one of 41 ABG events over the winter (November 2023 to February 2024). Many attendees (151) provided feedback, with most (65%) making changes in direct response to attending, including:
- A closer scrutiny of costs (30%)
- Adapting fertiliser approach (22%)
- Making rotational changes (18%)
- Adjusting cultivation approach (10%)
- Better record keeping (9%)
Almost a quarter (23%) said they had made large savings (£10,000–£30,000).
Attendees cite many other reasons why they find the meetings useful, including: general discussion (58%), making comparisons with similar farms that use different methods (34%), openness and honesty between group members (19%) and reassurance that they are not alone in their scenarios and challenges (18%).
Data lessons
Anonymised and aggregated Farmbench data can also reveal key trends – for example, those linked to average variable costs, overhead costs, income and full economic net margins per hectare.
In the following analyses, we examine data for the past five production years* (2018–2023) for wheat and oilseed rape.
In recent years, two headline-grabbing patterns have emerged: significant fluctuations in income and increasing costs.
Wheat results
.JPG) AHDB
AHDB
Source: AHDB Farmbench
The chart for winter wheat is based on a minimum of 400 UK wheat enterprises each year.
With its high total income (£2,552/ha) and strong average net margin (£1,097/ha), 2021/22 stands out. Tight global wheat supplies and the start of the war in Ukraine drove strong market prices.
Since then, prices have dropped, with net margins in 2022/23 much closer to those seen in 2018/19 and 2019/20, at around 15% of total income. With an underlying trend of increasing variable and overhead costs over the last three years, there is concern that net margins will continue to be squeezed.
Increased fertiliser costs and, to a lesser extent, crop protection costs are the main variable cost culprits. The average fertiliser cost for wheat crops in 2022/23 was £432/ha, compared with an average of £226/ha over the previous four years (a 90% increase).
Oilseed rape results
.JPG) AHDB
AHDB
Source: AHDB Farmbench
The chart for winter oilseed rape is based on a minimum of 200 UK oilseed rape enterprises each year.
In 2019/20, relatively low yields – 12% under the five-year Farmbench average yield – contributed to the poor performance. On average, crops lost £114/ha. Yield reduction was potentially even greater, according to Defra (down 22%), suggesting an even larger fluctuation in net margins across the UK.
Like wheat, strong market prices underpinned higher net margins in 2021/22, as well as 2020/21. When market prices fell in 2022/23, it exposed the impact of increasing costs, with oilseed rape losing an average of £201/ha. In this production year, fertilisers were associated with 64% of the total variable costs (previously, they were typically under 50%).
Overhead costs
For both crops, rising overhead costs are associated with a broad range of categories, including labour, machinery, equipment, property and energy. Over the five-year period evaluated, such costs increased by an average of 15% to 20%.
We are currently analysing results for 2023/24, which will be discussed at ABGs this winter.
Join the community
- Develop your potential
- Learn from and alongside your peers
- Get expert insight
- Understand production costs
- Investigate pricing strategies
Visit our web pages for information, including how to use Farmbench and how to join an ABG.
*Notes: The full economic margin data includes all imputed costs, such as family labour and rental equivalent on owned land. The production years indicate when the crop was grown and harvested (not marketed). For example, 2022/23 relates to crops harvested in 2023.
Meet the Farmbench team at CropTec
Visit AHDB in Hall 2 (stand 2.510) at the CropTec show at the NAEC, Stoneleigh, Warwickshire on 27–28 November 2024.
Business tools
We be on-hand to demonstrate Farmbench and discuss the benefits of joining Arable Business Groups.
Business seminars
Amandeep Kaur Purewal (AHDB Senior Economist) and Helen Plant (AHDB Senior Analyst) will present in the CropTec Profit Theatre.
On day 1, Amandeep will assess the impact of the Sustainable Farming Incentive on farm businesses (12:30pm – 1:30pm).
On day 2, Helen will examine what is driving grain prices (2:30pm – 3:30pm).
Topics:
Sectors:
Tags:


