How exposed are you to feed price increases?
Wednesday, 11 August 2021
By Patty Clayton
Feed prices have been relatively high this year, putting pressure on farmer margins. The variable quality of silage, means even those with full clamps may need to purchase in additional feed. With risks remaining around further increases in feed prices as we move towards the winter months, it’s worth assessing the extent that margins are exposed.
We’ve previously looked at the milk to feed price rate for farmers on different milk contracts, as prices have differed by market segment. While this provides some insight into the difference in margin pressure faced by individual farmers, it assumes all farms face the same exposure to high prices for bought-in feed. Differences in farming systems, overall yields and the amount of concentrate used per cow mean the level of risk is not the same for all farmers.
The table shows the average amount of concentrate feed fed per litre produced[1] across calving systems and type of contract over a 7-year period from 2012/13 to 2018/19.
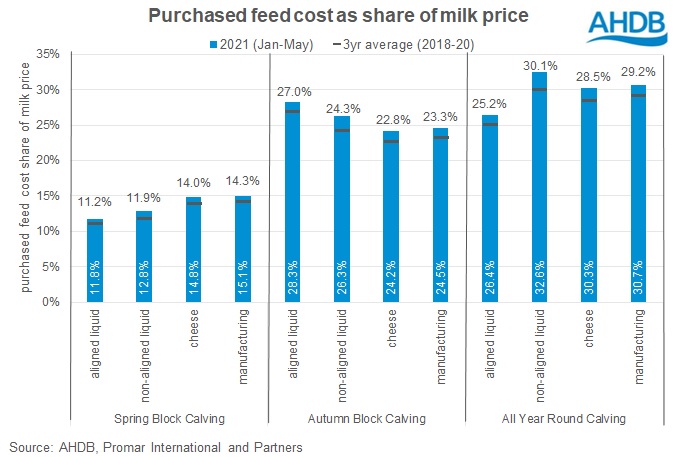
To assess how exposed farms are to increases in feed prices, we’ve measured what proportion of the annual average milk price[2] is used to cover the cost of purchased concentrate feed per litre of milk[3]. The feed cost per litre has been calculated using average concentrate prices.
This measure is shown in the below chart, which compares the average share of feed costs from the past 3 years (2018-2020) to year-to-date figures for 2021 (Jan-May 2021).

Regardless of milk contract, or calving system, feed is taking a larger share of the milk price so far this year than on average. Given its low reliance on purchased feeds however, spring block calving systems have been less impacted than other systems.
By knowing where your farm typically operates in terms of exposure to purchased feed costs, you can determine the risk to your margin in the light of potential changes in both feed and milk prices, relative to your overall feed demand.
Our Agri-market outlooks provide that insight, highlighting the key trends and elements that will shape those trends in the next few months.
The AHDB feed and forage calculator helps to determine your feed demand, and here is the page for regular updates on feed market developments.
[1] Includes youngstock and milking herd
[2] Based on AHDB standard litre prices by contract type (aligned liquid, non-aligned liquid, cheese and manufacturing)
[3] Cost of purchased feed per litre = kgs of concentrate used per litre of milk x average price per tonne of concentrate (based on Promar and Kingshay reported concentrate prices).
Sign up to receive the latest information from AHDB.
While AHDB seeks to ensure that the information contained on this webpage is accurate at the time of publication, no warranty is given in respect of the information and data provided. You are responsible for how you use the information. To the maximum extent permitted by law, AHDB accepts no liability for loss, damage or injury howsoever caused or suffered (including that caused by negligence) directly or indirectly in relation to the information or data provided in this publication.
All intellectual property rights in the information and data on this webpage belong to or are licensed by AHDB. You are authorised to use such information for your internal business purposes only and you must not provide this information to any other third parties, including further publication of the information, or for commercial gain in any way whatsoever without the prior written permission of AHDB for each third party disclosure, publication or commercial arrangement. For more information, please see our Terms of Use and Privacy Notice or contact the Director of Corporate Affairs at info@ahdb.org.uk © Agriculture and Horticulture Development Board. All rights reserved.


