Stacking options for SFI 2026: Arable

What is the economic impact of the Sustainable Farming Incentive (SFI) on farm businesses? We calculated the likely effect on arable farm profit levels of stacking SFI actions over a three-year period.

See our stacking analysis on two other sectors:

Main findings

  • The SFI alone is not going to be enough to mitigate the loss of Direct Payments – this is an intentional design of the scheme. But the right combination of actions could make up a considerable amount of the shortfall
  • Taking part in the SFI can provide substantial extra income for arable farm businesses
  • If farmers carefully select actions that are right for their farm, they can boost the farm’s net profit level
  • If actions can be carried out on unproductive areas of the farm without sacrificing the area of cash crops, an increase in net profit is likely; such actions are also likely to help regenerate unproductive land and make it more productive in the long term
  • Farmers have the opportunity to maximise the potential of every hectare of land on their farm
  • The SFI has a greater impact on farms with low gross profit margins compared with those that have high gross profit margins
  • For all farms, the financial benefit of taking part in the SFI is most likely to be felt in years where crop prices are average or below average; it can act as buffer in lean years
  • Looking ahead, the SFI can play a role in stabilising farm business incomes

Stacking of SFI26 actions on virtual arable farm

Table 1 shows which actions were included along with payment rate and the area of the virtual farm selected for each action.

Table 1. SFI actions with payment rates and area of land

CodeActionPaymentArea or length
CSAM2 Multi-species winter cover crop £129/ha 75 ha
CHRW2 Manage hedgerows £13 per 100m – one side 23,200 m
CIPM2 Flower-rich grass margins, blocks or in-field strips £798/ha 5 ha
CIPM3 Companion crop on arable land £55/ha 31.5 ha
CIPM4 No use of insecticide on arable crops and permanent crops £45/ha 67.5 ha
PRF1 Variable rate application of nutrients £27/ha 142 ha
SOH1 No-till farming £73/ha 76.5 ha
SOH3 Multi-species summer-sown cover crop £163/ha 140 ha
CNUM3 Legume fallow £593/ha 1.5 ha
CAHL1 Pollen and nectar flower mix £739/ha 5 ha
CAHL2 Winter bird food on arable and horticultural land £853/ha 5 ha
CAHL3 Grassy field corners and blocks £590/ha 4.5 ha
CAHL4 4m to 12m grass buffer strip on arable and horticultural land £515/ha 0.4 ha
AHW2 Supplementary winter bird food £732 per tonne 2.5 t
AHW9 Unharvested cereal headland £1,072/ha 0.28 ha

Source: Defra, AHDB

The 455 ha arable farm has 22 ha of unproductive land, which equates to 5% of the farmland available. Land requiring actions (CIPM2, CNUM3, CAHL1, CAHL2, CAHL3, CAHL4, AHW9) were selected for this unproductive land. The other actions listed in Table 1 could be carried out as part of the farm’s rotation or without requiring additional land.

What are the key differences between SFI26 and SFI24?

  • There are fewer actions to choose from – SFI26 has 71 actions available, compared with 102 for SFI24. Actions which had low uptake, or were considered to be low value for money, were removed for SFI26
  • Actions such as soil assessment plans, integrated pest management plans, nutrient management plans are no longer available for SFI26
  • The SFI management payment, which paid farmers £2,000 in year 1 of an SFI agreement and £1,000 in years 2 and 3, has also been removed for SFI26
  • Our analysis of the SFI24 offer showed that the 455 ha arable virtual farm received around £6,000 from the management payment and management plans in year 1 of the SFI agreement and around £5,000 in year 2 and year 3
  • SFI26 agreements are capped at £100,000 per year. There was no cap on agreements for previous iterations of the SFI
  • Each farm business can only have one SFI26 agreement (in previous iterations multiple agreements were possible)
  • The maximum area of land that can be added to rotational action cannot exceed the area of land entered in the first year of the agreement. Under SFI24, it was possible to increase the area on an annual basis or to decrease it by no more than 50% of the area entered in the first year
  • There are still 10 limited area actions, but AHW1 bumble bird mix is replaced with AHW7 enhanced overwinter stubble

Updated 3 July 2026

Methodology

For this analysis, we used our 455 ha arable virtual farm. The AHDB virtual farms are theoretical farms that exist on a spreadsheet but are designed to be representative of ‘typical farms’. They have been created as middle 50%-performing businesses: this means that their performance is comparable to actual national or regional averages. The costs associated with these middle-performing farms also tend to be higher than on farms in the top 25%, and these costs have been cross-referenced to average results from the Farm Business Survey.

Detailed description of the arable virtual farm

The 455 ha arable virtual farm in this analysis is in the East of England and has:

  • 450 ha of farming land
  • 5 ha of land allocated to woodland, buildings and roads

The analysis used 2025 as the baseline year, as this is the most recent year for which there is a full set of annual data.

We allocated different areas of the farm to actions included in this analysis and calculated the cost of carrying out each of the SFI actions on that area. This provided a net payment for each SFI action.

Net payments were calculated for each of the three years of the SFI agreement, taking into account that one-off costs and annual costs were incurred, depending on the action.

To examine the effect on the farm of taking part in the SFI, all other variables – such as prices and yields – were kept constant over the three-year time frame (2026–2028). The net payments were incorporated into the virtual farm’s balance sheets to calculate the net profit (total revenue minus total costs) for a given year. The change in the farm’s net profit in taking part in the SFI compared with not taking part in the SFI was then calculated.

What’s the overall impact of SFI26 on the farm’s net profit?

Figure 1 shows that the net profit (total revenue minus total cost) of the farm increases by 15–25% each year between 2026 and 2028.

Figure 1. Effect on 455 ha arable farm’s net profit level

Source: AHDB

The gross profit of the 455 ha arable farm (using 2025 as a baseline) is £1,094/ha. If the gross profit was around £869/ha, the farm’s net profit would increase by 55% in year 1, 92% in year 2 and 91% in year 3.

The impact of the SFI is greater on farm businesses with low gross profit margins than those with high gross profit margins.

How much money can the farm make from SFI26?

Figure 2 shows the income that would be received by AHDB’s 455 ha arable virtual farm from taking part in SFI26.

Figure 2. Three-year projection of income received by a 455 ha arable farm from direct payments and SFI actions

Source: AHDB

A breakdown of SFI payments

As a result of carrying out the SFI actions, the farm receives £30,960 on average per year over the three-year duration of the SFI agreement. The total income received over the 3-year SFI agreement is £92,875.

Optimisation of selected SFI actions

Out of the land requiring actions selected for the 455 ha arable farm, CAHL1 (pollen and nectar flower mix) and CAHL2 (winter bird food on arable and horticultural land) provided the highest net income. While on an individual basis, the net income from CAHL1 was higher compared with CAHL2 (check income breakdown figures), the supplementary winter bird food action (AHW2) available for CAHL2 tipped the balance in CAHL2’s favour.

This presented two potential scenarios:

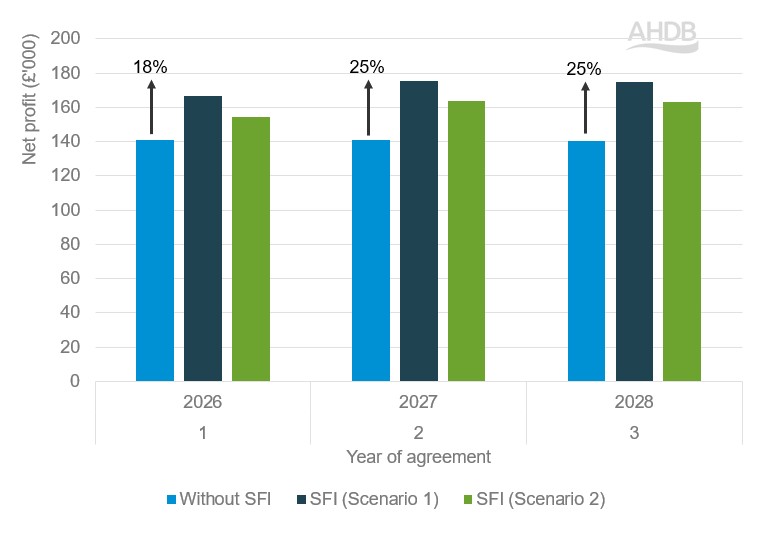
  • Scenario 1 – All 22 ha of the 455 ha arable farm’s unproductive land was entered into the actions, CAHL2 and AHW2
  • Scenario 2 – The maximum amount of the 455 ha arable farm’s land, in accordance with the 25% area limit, was entered into CAHL2 and AHW2. The area cap meant that no more than 112.5 ha of the farm could be entered into CAHL2 and that productive areas of the farm would also be used

Figure 3 shows that under scenario 1, the net profit of the farm increases by an average of 23%, similar to the level shown in Figure 1. However, scenario 1 achieves this increase by the farm selecting fewer actions and the total income the farm receives over the three years is a few thousand pounds higher (£95,328 compared with £92,875).

A variety of SFI actions may be beneficial depending on the objectives of the farm and the associated environmental outcomes. However, from a purely economic and time management perspective, it may be better to select single or a few actions which provide the greatest return.

Figure 3. Effect on 455 ha arable farm’s net profit level under scenarios 1 and 2

Source: AHDB

Under scenario 2, the net profit of the farm increases by an average of 14% as the removal of productive land from production offsets part of the benefit of the additional income received from increasing the area allotted to the action.

This is why it is important to consider the opportunity cost involved when selecting land requiring SFI actions. The AHDB SFI cost/benefit tool provides guidance and the means to factor this into your own cost calculations.

Conclusions

The 455 ha arable virtual farm in this analysis received an average of £30,960 in net income from taking part in SFI26. This doesn’t mitigate the loss of direct payments which the farm received (£104,850) in 2020 before phased reductions began, but makes a considerable difference to the farm’s income. The SFI is not designed to mitigate the loss of direct payments and farmers will need to explore a variety of options to make up the shortfall.

The net profit (or bottom line) of the 455 ha arable farm was around 23% better off, on average as a result of taking part in the SFI. Optimising the returns the farm can receive from the SFI can be achieved by comparing the net benefit of various actions. It may be that selecting one or a few actions on an area of land may deliver a higher net income than selecting a variety of actions, while also saving additional time related to the management of these actions.

However, a variety of actions may be required to fulfil specific environmental outcomes on farm which will benefit the farm in the long term.

Generally, land requiring SFI actions are best carried out on unproductive areas of the farm without sacrificing the area of cash crops, and an increase in net profit is likely under these circumstances. This may also help regenerate unproductive land and make it more productive in the long term. If the area where cash crops grow has to be compromised to make space for SFI actions, however, net profit levels are likely to suffer.

Each farm is different – careful planning and selection will help businesses to maximise their economic and environmental potential from the SFI. From the economic perspective, AHDB’s SFI cost benefit tool allows farmers to examine the net benefit of actions for their own farms, including assessing the opportunity cost involved.

No single action in the SFI is going to be enough to mitigate the loss of direct payments, but the right combination of actions could go a long way to make up some of the shortfall. This will be more pronounced and helpful to farm businesses in years of average or low crop prices rather than in years in which prices are high.

Similarly, farm businesses with lower gross profit levels will benefit more from the SFI than businesses with higher gross profit levels.

The SFI will have a role in stabilising farm incomes, as has been the case for direct payments and the wider Basic Payment Scheme. Gains from the SFI will be amplified in low/average cost years and for businesses with low gross profit levels. But, if a loss is made, that too will be amplified under these conditions. This highlights the importance of choosing actions with care and making the best plan for your farm.

Useful links

SFI cost benefit tool

Access more information about the SFI cost/benefit tool

Sustainable Farming Incentive

Environmental Land Management Schemes

Climate resilience on-farm action planner

Carbon markets

Preparing for change: the characteristics of top performing farms

Explore the main SFI stacking options page

×