- Home
- Knowledge library
- Applying GWP* to UK national GHG emissions
Applying GWP* to UK national GHG emissions
Applying this alternative metric to methane emissions at a national scale.
AHDB, with others, advocate for the need for dual reporting when it comes to greenhouse gas (GHG) emissions. Using GWP* as well as the standard GWP100 will better reflect the warming impact of short-lived gases like methane. This in turn will help better identify where efforts to mitigate emissions should be focused. For instance, based on analysis of GWP*, no additional warming has arisen from UK methane emissions over the last 20 years.
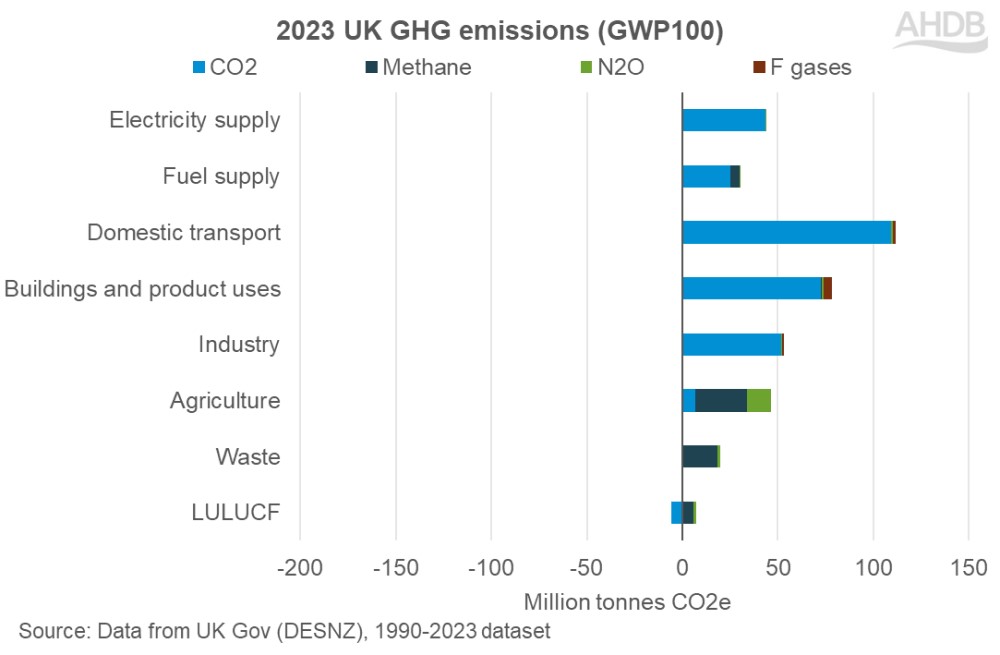
Here we will explore what dual reporting could look like at a national level. The GHG National Inventory shows us UK emissions (and some sequestration) by gas and by sector. This is reported using GWP100 conversions to CO2 equivalent[1]:

Under this reporting method (GWP100), methane would appear to be a key source of emissions for both agriculture and waste management. However, because methane breaks down quickly, it’s not necessarily a source of additional warming. To understand the additional warming we need to look at how current emissions compare to past emissions. That is where GWP* comes in.
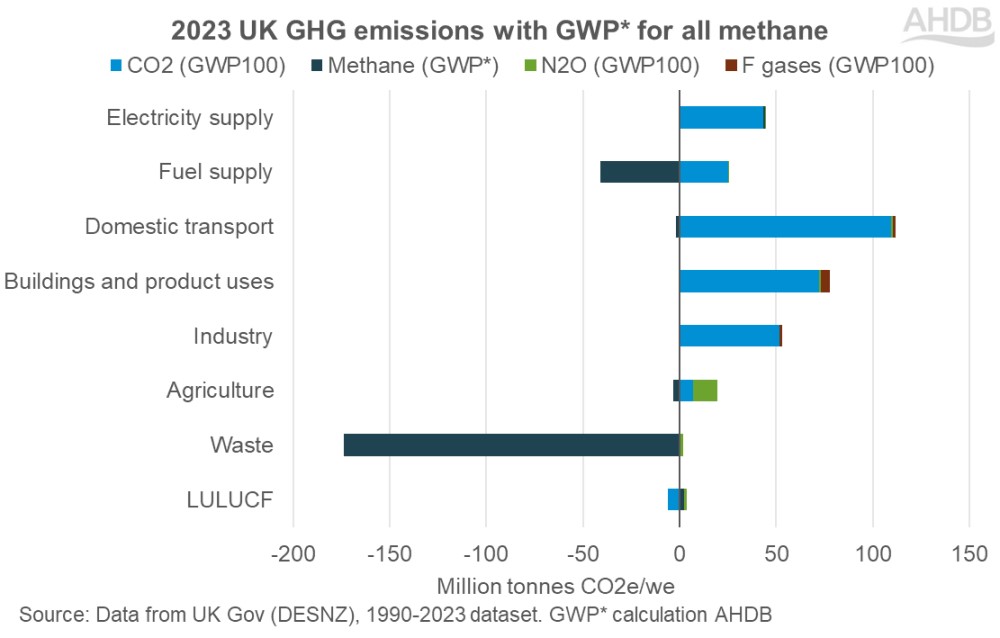
If we apply GWP* to the methane emissions, the change in emissions over time is taken into account, and the picture changes:

Under GWP* methane emissions in the UK show a slightly negative CO2 warming equivalent. In other words, no additional warming arose from UK methane emissions in 2023. That is because methane emissions in the UK have been gradually reducing over time, and old methane has broken down at a rate comparable to the emission rate of new methane.
In fact, because UK (and agricultural) methane emissions have fallen steadily for some time, no additional warming has arisen from UK methane emissions over the last 20 years.
The table below shows the overall emissions in the UK, and the emissions attributed to agriculture. Although agriculture’s emissions total is reduced under GWP*, it’s share increases to 15% as the UK total is also lower. However, we should remember the number of limitations of the GHG National Inventory remain for this calculation. Namely, that sequestration is not included against agriculture’s silo, and neither are energy or waste mitigations.
What the GWP* calculation does highlight, however, is the need to address N2O emissions. These can be reduced by improving practices around application of mineral and organic fertilisers, and manure management.
Table: UK greenhouse gas emissions 2023
|
|
Agriculture (million t CO2 eq) |
All sectors (million t CO2 eq) |
||
|
GWP100 |
GWP* |
GWP100 |
GWP* |
|
|
Carbon Dioxide (CO2) |
6.9 |
6.9 |
302.8 |
302.8 |
|
Methane (CH4) |
27.2 |
-3.3 |
57.0 |
-217.1 |
|
Nitrous Oxide (N2O) |
12.5 |
12.5 |
18.1 |
18.1 |
|
F gases |
0.0 |
0.0 |
7.0 |
7.0 |
|
Total (CO2 eq) |
46.6 |
16.1 |
385.0 |
110.9 |
|
% of all emissions |
12% |
15% |
|
|
Source: Data from UK Gov (DESNZ), 1990-2023 dataset. GWP* calculation AHDB.
While our focus is on the UK’s emissions, the picture may not be the same worldwide. Under GWP* stable emissions cause no additional warming, but increased emissions have a stronger warming impact than shown by GWP100. In the UK, most of our herd expansion was in the 20th century. GWP* considers changes in the last 20 years, a period where UK cattle and sheep numbers have reduced overall, thereby reducing our agricultural methane emissions. In contrast, developing countries that are expanding their herds would find using GWP* increases the significance of methane in their emissions.
Dual reporting using GWP* as well as GWP100 is a useful tool for businesses to understand the warming potential from their activities. As shown here, it can highlight the impact of emissions and where action should be targeted.
[1] Data is from Final UK greenhouse gas emissions statistics: 1990 to 2023 - GOV.UK, published February 2025.

