- Home
- Knowledge library
- How to apply carbon audits and mitigation plans
How to apply carbon audits and mitigation plans
See what you could get from a carbon audit and what actions could improve your footprint, based on the results from our strategic and monitor farm carbon audits.
Conducting a carbon audit can provide carbon footprints at the whole-farm or enterprise levels. These can identify the main sources of greenhouse gas (GHG) emissions – the hotspots – therefore pinpointing the key opportunities for both business and environmental improvement.
AHDB farm carbon audits
Two waves of carbon audits have been conducted on AHDB Strategic and Monitor Farms so far. These aimed to:
- Create baselines for the farm, if not previously audited
- Demonstrate the potential for emissions reduction
- Develop bespoke carbon mitigation plans for each farm, with practical and effective recommendations to reduce GHG emissions
- Assess the extent of uptake of low-emission practices and understand the barriers to implementation
Table 1: Overview of carbon audit waves
|
Wave |
Period |
AHDB sectors |
Number of farms |
|---|---|---|---|
|
Wave 1 |
2020/21 |
Beef & Lamb, Cereals & Oilseeds, Dairy and Pork |
44 |
|
Wave 2 |
2021/22 |
Cereals & Oilseeds and Dairy |
16 |
From the first meeting, data was collated and a carbon audit report was generated that showed the following measures:
- Emissions contributions from the main GHGs: carbon dioxide (CO2), methane (CH4) and nitrous oxide (N2O), presented as carbon dioxide equivalents (CO2e)
- Whole-farm carbon footprint: farm operations minus carbon sequestration for a net emissions footprint
- Footprints for each enterprise within the business, e.g. milk, milling wheat
- Emissions by source: electricity, fuel, purchased bedding, purchased feed, fertiliser, manure management and enteric fermentation
- Benchmark comparisons +/- % from the average benchmark from the calculator’s database
- Product emissions: CO2e/kg, allows comparison on a per unit product basis
- Estimated carbon sequestration from soil and biomass such as woodland
(the carbon calculator Agrecalc was used in both waves; other carbon calculators are available to suit individual needs)
In the follow-up meeting, current practices were discussed in relation to the carbon footprints, and a bespoke carbon mitigation plan was created. The plans covered current actions as well as suitable short-, medium- and long-term actions.
Key findings and hotspots
Emissions were reported using GWP100 conversions to CO2 equivalent. While it has been recognised that this can overstate the warming impact of biogenic methane, GWP100 is the international standard method for reporting GHG emissions.
Findings by sector
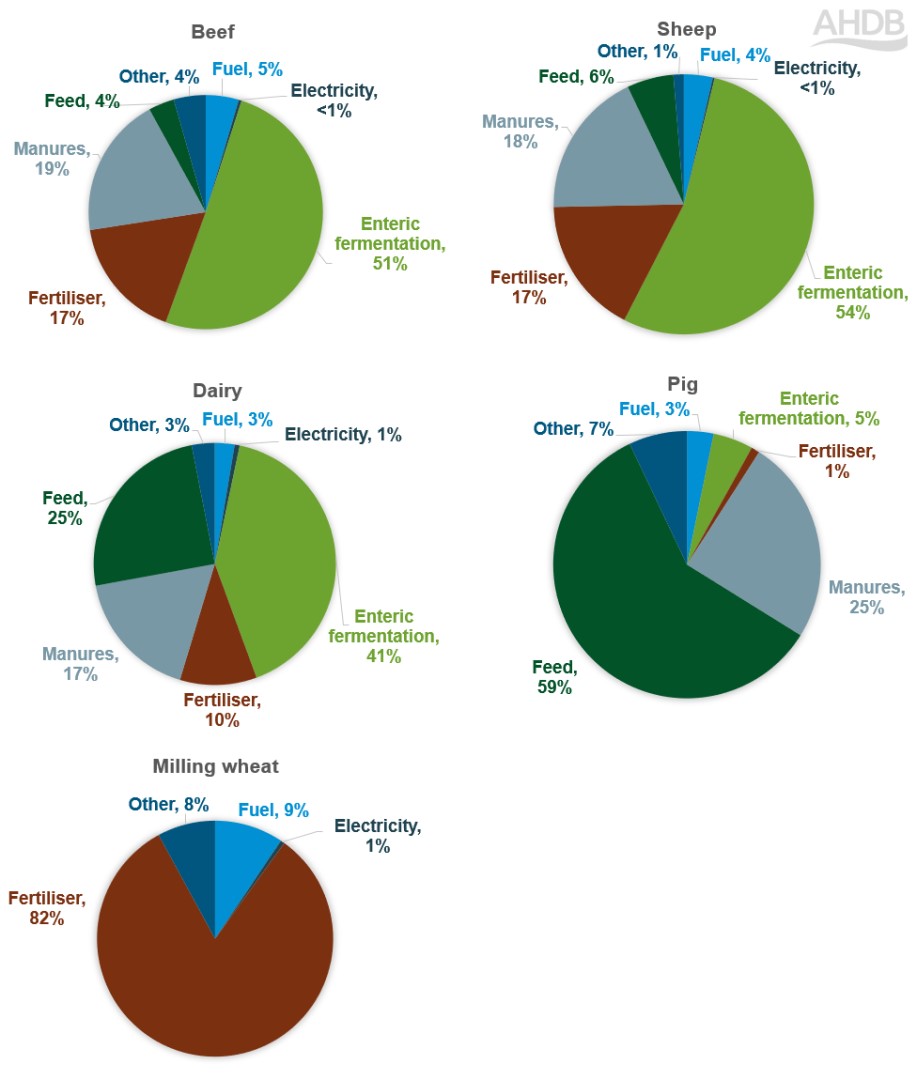
- For both beef and sheep enterprises, enteric fermentation (methane) was the main source of GHG emissions (>50%) followed by manure management (Figure 1).
- In dairy (milk), emissions from enteric fermentation also dominated, but the second greatest source was feed, at 25%. “Feed” comprises the embedded emissions from growing, harvesting, processing and transporting feed.
- For the pig enterprise, feed was the largest contributor to emissions, with the choice of feed (e.g. soya content) also affecting the carbon footprint.
- Fertiliser was the major emission for milling wheat at 82%. This included the emissions from manufacturing, as well as nitrous oxide from application and use. Fuel was the second largest emissions source.
All these footprints are average emissions and cover a range of systems and management practices.
Figure 1. Average enterprise emissions from wave 1

Please note that the sample sizes were limited: Beef = 20, sheep = 14, dairy = 12, pigs = 3 and milling wheat = 8.
Learning points and actions to reduce carbon footprints
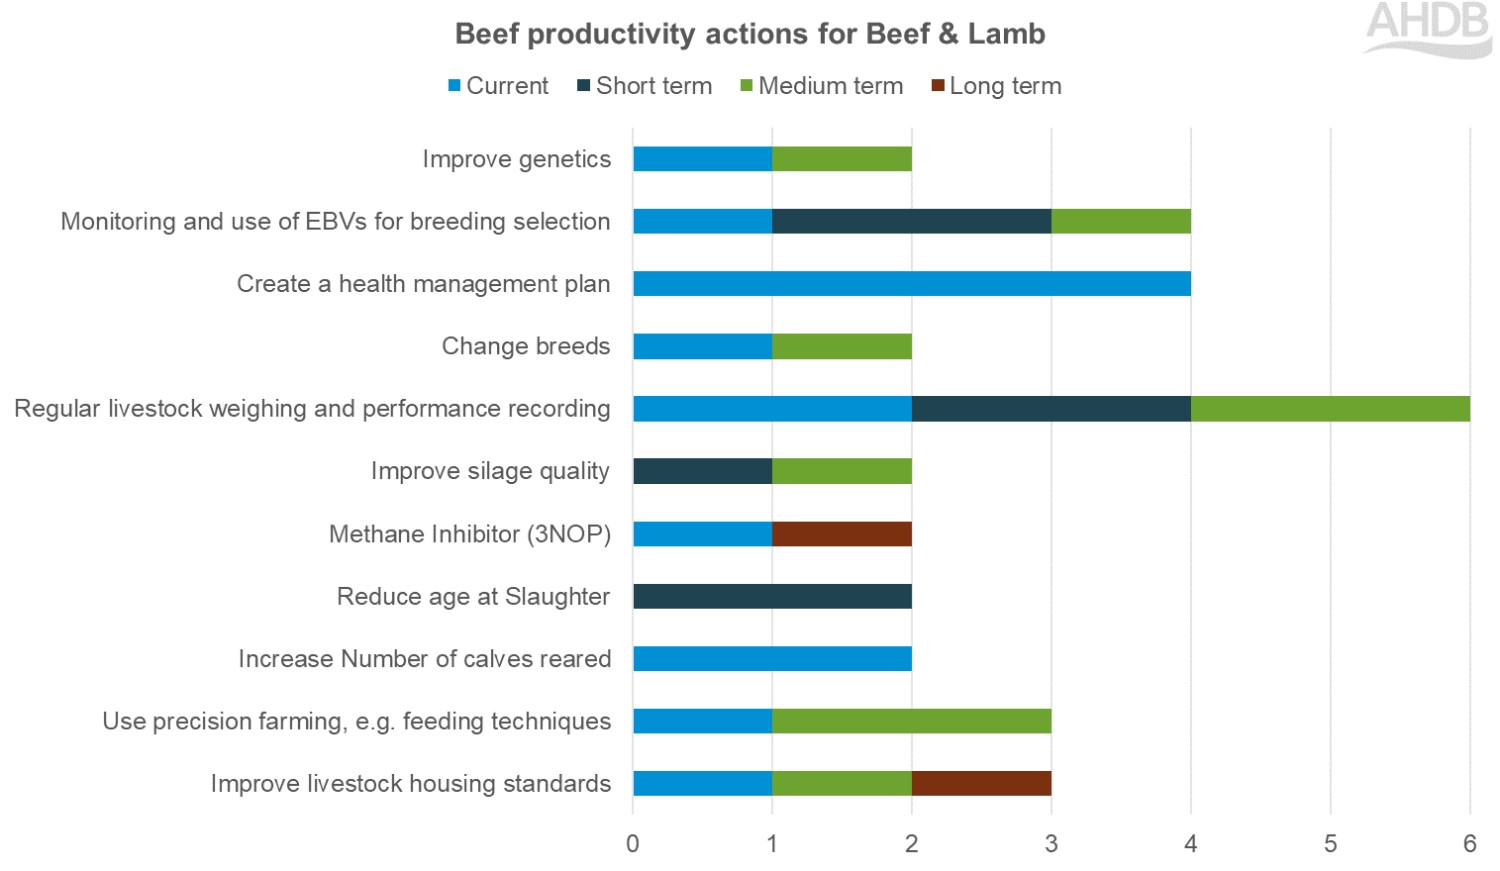
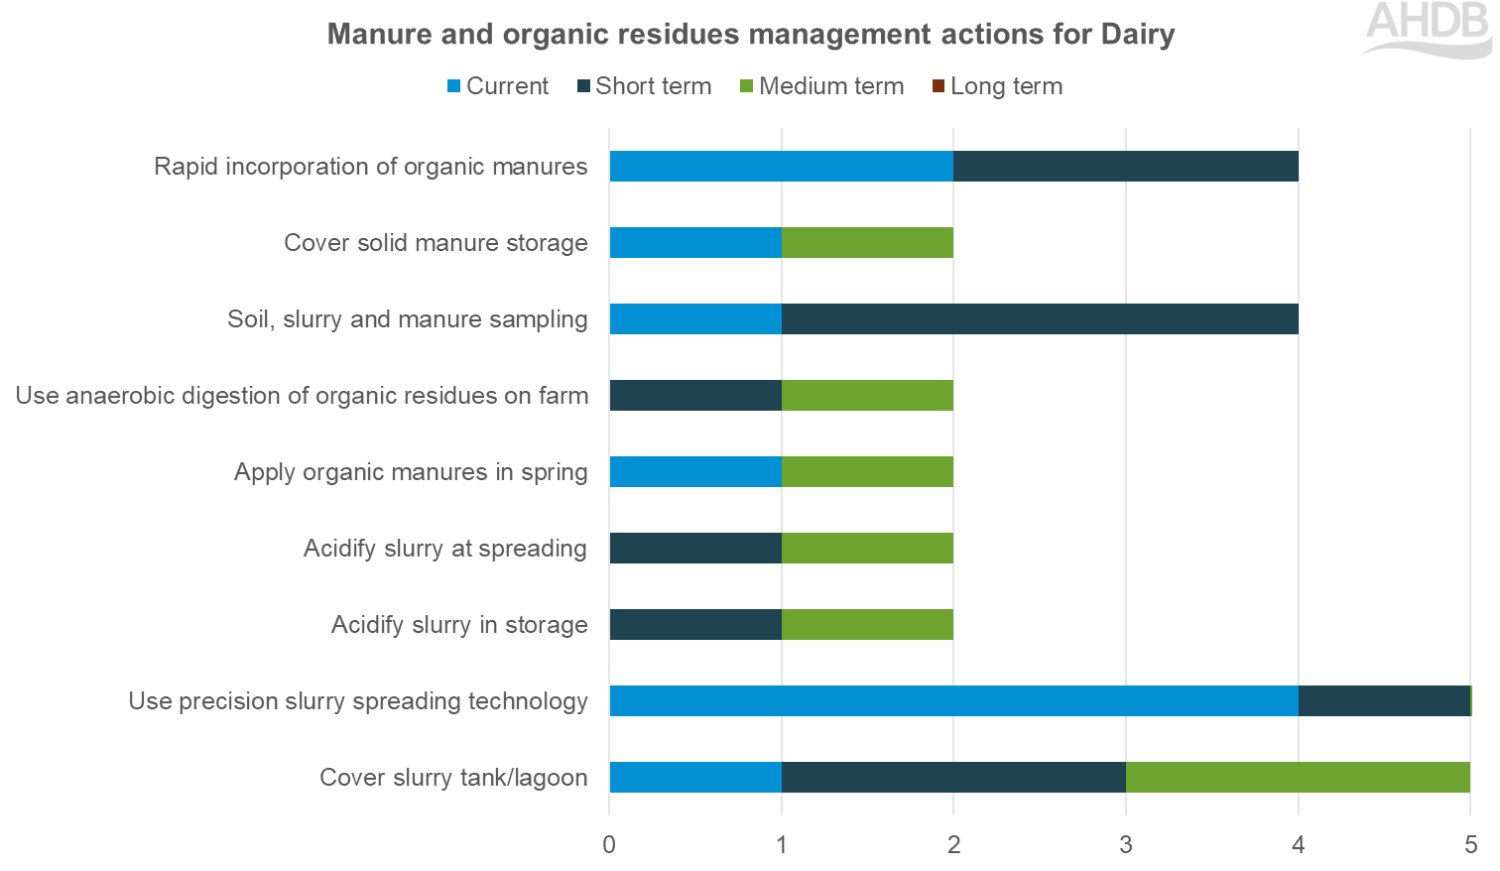
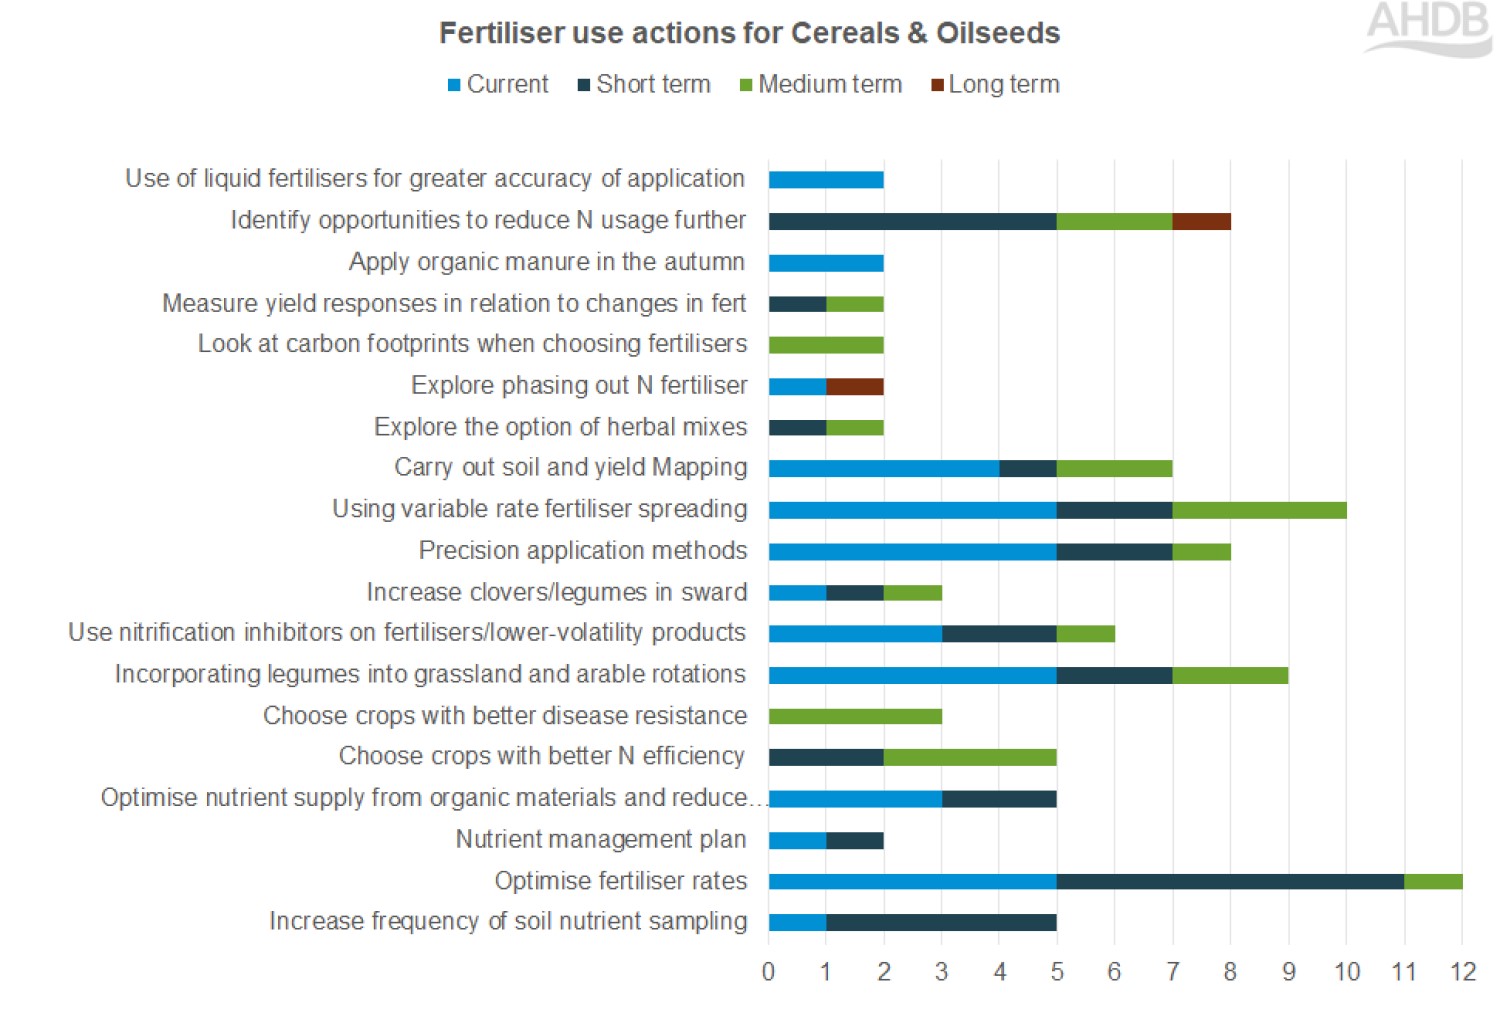
A range of low-carbon practices were already being implemented, and a number of actions were planned for the short, medium or long term. Figures 2-4 shows some examples of both current and prospective actions that most closely relate to the sector emissions hotspots in wave 1.
Figures 2–4. Examples of current and planned actions on a sector basis (wave 1)


Timeframes: short-term = in the next year, medium-term = 2–5 years, long-term = 6–10 years
The main actions, opportunities and challenges from the FEP carbon audits can be summarised as follows:
Fertiliser
Current actions:
- Optimising nitrogen fertiliser application rate using nutrient planning and variable-rate application, which should be continued
Opportunities and challenges:
- More efficient application methods (e.g. foliar N, fertiliser placement practices) can enable emission reductions
- Expanding legumes in the rotation and using inhibitors
- Emerging opportunities for fertilisers with lower production emissions (e.g. processed organic materials, fertiliser from blue or green ammonia)
Fuel
Current actions:
- Use of best practice on machinery maintenance and generally upgrading equipment when cost-effective. Many farms are using reduced-tillage approaches
Opportunities and challenges
- Opportunities around recording fuel use (although this takes time)
- Installing renewable energy, though there are issues with planning, grid capacity, financing
Enteric methane
Current actions:
- Active in monitoring relevant productivity KPIs and herd health planning
Opportunities and challenges:
- Improvement of housing conditions to support welfare and productivity, but there are financial constraints
- The main future opportunities are likely to be feed additives – 3NOP, nitrates, essential oils, etc.
- Improving digestibility of the diet through improved silage production and alternative forages will also help to address enteric methane and reduce feed emissions simultaneously
Feed and bedding
Current actions:
- Focus on improving quality of home-grown forage through better management or switching to higher-energy alternatives
Opportunities and challenges:
- There is a desire to reduce soya but challenges finding cost-effective replacements
Manure management
Current actions:
- There is wide adoption of low-emission spreading techniques and farmers are incorporating manures into nutrient management planning
Opportunities and challenges:
- There is a desire to improve storage facilities, but a lack of finance
Carbon stores and sequestration
Current actions:
- Reducing tillage intensity in all arable farms and most livestock farms
- Silvopastoral systems being tried on some farms
- Cover crops are popular in arable systems
Opportunities and challenges:
- Farmers are keen to expand farm carbon stores but need grants and other support. But there is lack of clarity on what funding is available, resulting in delayed action
Monitoring progress in performance
Five dairy farms participated in both waves of audits and therefore any changes in performance were able to be tracked.
Overall, three farms showed emission reductions of 8–39% over the two assessments, while two showed an increase in emissions of 10–24% (excluding soil carbon).
The differences in emissions between years resulted from:
- Different input levels, e.g. reduction in purchased feed, electricity
- Different output levels, e.g. increased yields of meat and milk
Takeaways and recommendations
- Use the same carbon calculator to ensure that the footprints are made using consistent methodology
- Recording carbon footprints each year and creating multi-year averages will help provide better trends and reduce year-to-year seasonal variation
- Maintain past data on carbon calculator and extract data for all years at the same time when making a comparison so that carbon footprints are recalculated with the latest emissions factors
- Try to use the same 12-month period for auditing each year and ensure that data sources (e.g. invoices) align
- Create a carbon action plan, track progress of actions and use supplementary KPIs where possible (e.g. fuel use per hectare), as the calculators may not currently capture the impact of all the carbon plan actions. So recording progress separately, if possible, will capture all practices, thus enabling a better understanding of how the farm is improving
Download the report
Topics:
Sectors:
Tags:

